. 2006 Jun 7;25(11):2453-64.
doi: 10.1038/sj.emboj.7601106. Epub 2006 May 4.

Absence of the steroid receptor coactivator-3 induces B-cell lymphoma

Affiliations

Absence of the steroid receptor coactivator-3 induces B-cell lymphoma

Agnès Coste et al. EMBO J. .

Abstract

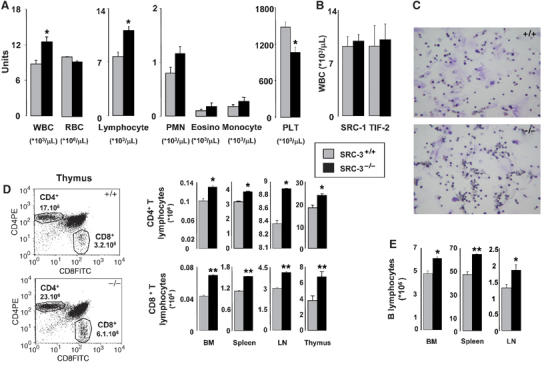
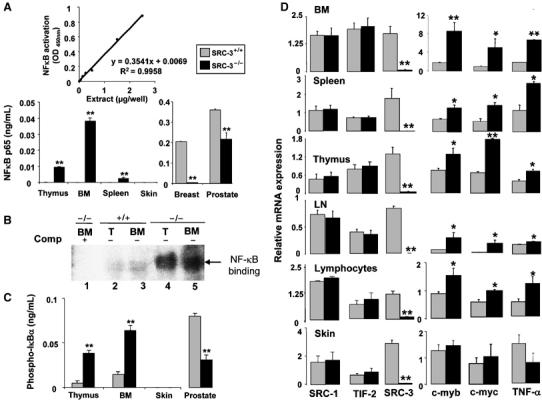
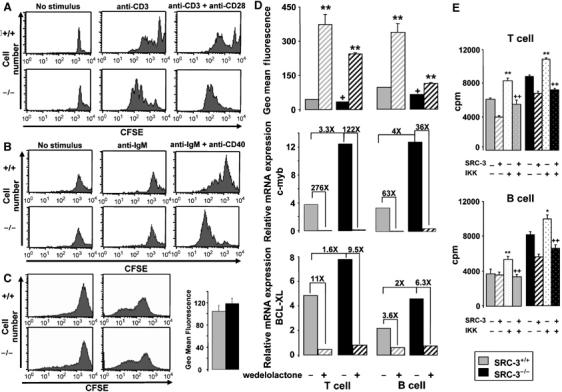
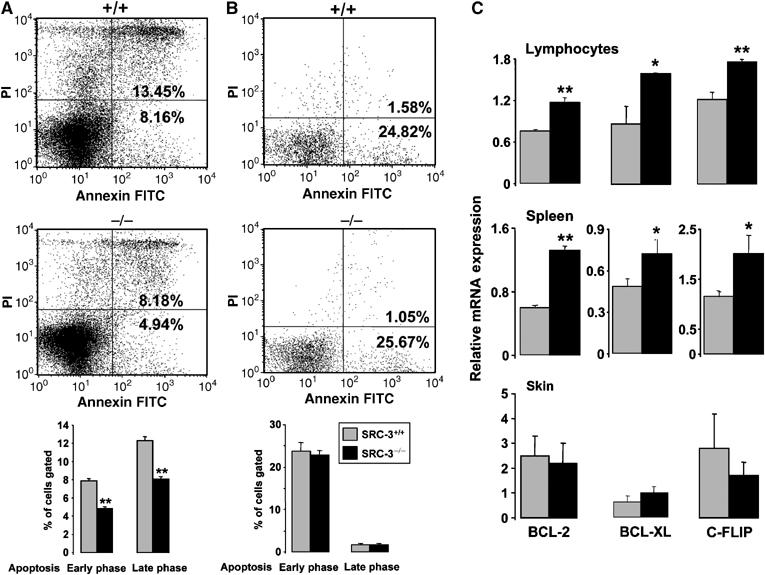
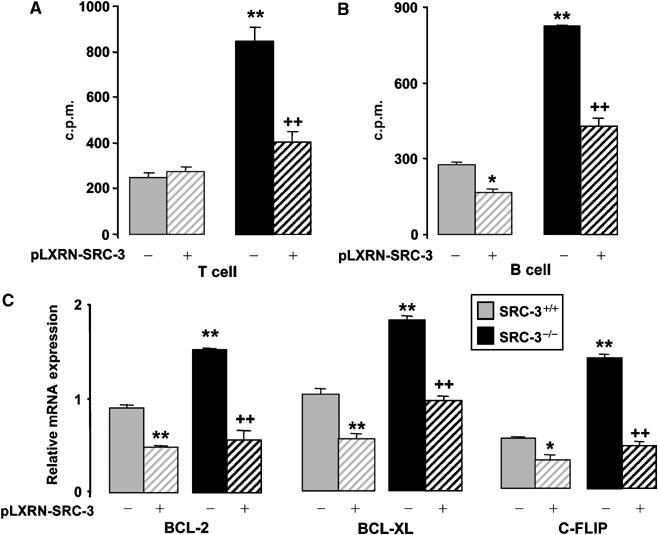
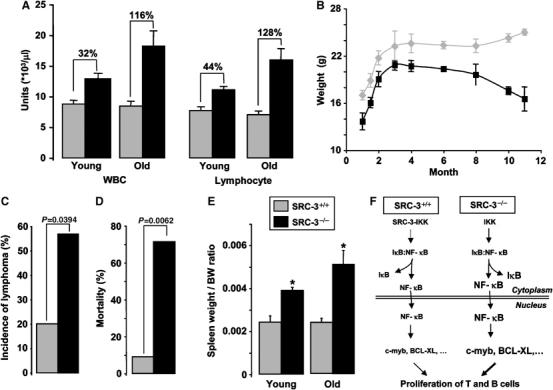
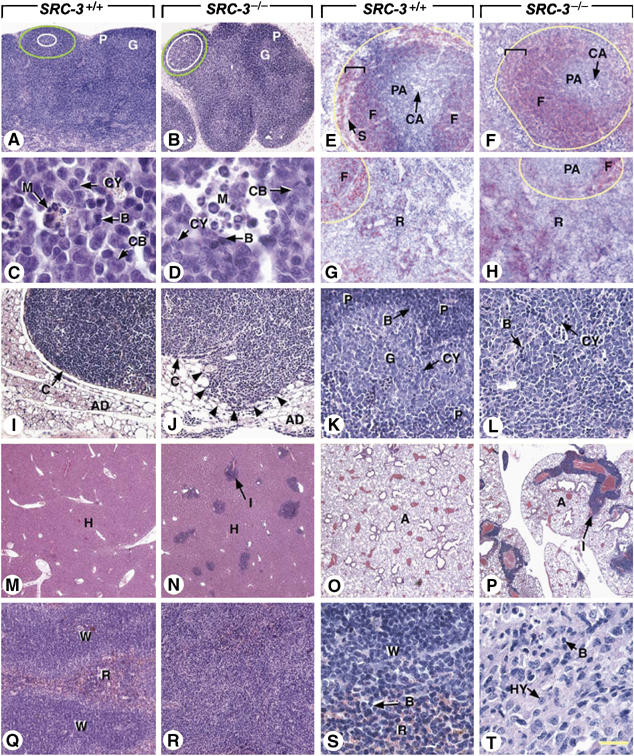
Steroid receptor coactivator 3 (SRC-3/ACTR/AIB-1/pCIP/RAC3/TRAM-1) is a member of the p160 family of nuclear receptor coactivators that plays an important role in mammary gland growth, development, and tumorigenesis. We show that deletion of SRC-3 gene decreases platelet and increases lymphocytes numbers, leading to the development of malignant B-cell lymphomas upon aging. The expansion of the lymphoid lineage in SRC-3(-/-) mice is cell autonomous, correlates with an induction of proliferative and antiapoptotic genes secondary to constitutive NF-kappaB activation, and can be reversed by restoration of SRC-3 expression. NF-kappaB activation is explained by the degradation of IkappaB, consequent to increases in free IkappaB kinase, which is no longer inhibited by SRC-3. These results demonstrate that SRC-3 regulates lymphopoiesis and in combination with previous studies indicate that SRC-3 has vastly diverging effects on cell proliferation depending on the cellular context, ranging from proliferative and tumorigenic (breast) to antiproliferative (lymphoid cells) effects.


Figures

Figure 1
Figure 1
Increased number of mature lymphocytes in SRC-3−/− mice. (A) Quantification of circulating white (WBC) and red (RBC) blood cells and platelets (PLT) in SRC-3+/+ and SRC-3−/− mice (age 7 weeks, n=8). *P<0.05; (B) quantification of circulating WBCs in SRC-1+/+, SRC-1−/−, TIF-2+/+, and TIF-2−/− mice (age 7 weeks, n=8); (C) histology of SRC-3+/+ and SRC-3−/− bone marrow showing the increase in the lymphoid series (× 20); (D) quantification of the proportion of CD4+T and CD8+T lymphocytes populations in bone marrow (BM), spleen, lymph nodes (LN), and thymus (shown also at the left of the panel) of SRC-3+/+ and SRC-3−/− animals by flow cytometry; (E) quantification of the proportion of B lymphocytes in BM, spleen, and lymph nodes of SRC-3+/+ and SRC-3−/− animals by flow cytometry. *P<0.05, **P<0.01.
Figure 2
Figure 2
Increased NF-κB activity induces the expression of c-myc and c-myb and underpins the lymphoproliferation. (A) Quantification of the nuclear p65 NF-κB in SRC-3+/+ and SRC-3−/− thymus, bone marrow (BM), spleen, skin, breast, and prostate by TransAM® ELISA kit. **P<0.01; (B) NF-κB DNA-binding activity in nuclear protein extracts of BM and thymus of SRC-3−/− (lanes 4 and 5) and SRC-3+/+ mice (lanes 2 and 3) analyzed by EMSA. Binding in the presence of excess of unlabeled NF-κB-binding oligonucleotide (lane 1) is included as control; (C) quantification of phosphorylated IκB-α in SRC-3+/+ and SRC-3−/− thymus, BM, skin, and prostate by ELISA. **P<0.01; (D) mRNA levels of SRC-1, TIF-2, SRC-3, c-myb, c-myc, and TNF-α in BM, spleen, thymus, lymph nodes (LN), lymphocytes, and skin of SRC-3+/+ and SRC-3−/− animals (age 7 weeks, n=8) as determined by quantitative RT–PCR. *P<0.05, **P<0.01.
Figure 3
Figure 3
Cell autonomous increase in lymphocyte proliferation. (A) T cells of SRC-3+/+ and SRC-3−/− spleen mice were stimulated by anti-CD3 and/or anti-CD28 and analyzed by FACS. In vitro proliferation assays were performed with the fluorescent dye CFSE. Loss of CFSE reflects cellular division. CFSE staining is presented from a representative experiment (one mouse). Each experiment was repeated three times with similar results; (B) B cells of SRC-3+/+ and SRC-3−/− spleen mice were stimulated by anti-IgM and/or anti-CD40 and analyzed by FACS. CFSE staining is presented from a representative experiment (one mouse). Each experiment was repeated three times with similar results; (C) in vitro proliferation assays of SRC-3+/+ and SRC-3−/− MEFs using the fluorescent dye CFSE. The left histogram represents CFSE staining in MEFs at t=0. The right histogram shows MEFs stained with CFSE and then cultured for 2 days; (D) T and B cells isolated from the spleens of SRC-3+/+ and SRC-3−/− mice (age 7 weeks, n=8) were stimulated by anti-CD3+anti-CD28 and anti-IgM+anti-CD40, respectively, in the presence or absence of wedelolactone (20 μM). The geometric mean fluorescence is inversely proportional to proliferation rate. +P<0.05 indicates a significant difference compared with SRC-3+/+ cells without wedelolactone. **P<0.01 indicates a significant effect of wedelolactone. mRNA levels of c-myb and BCL-XL in T and B cells of SRC-3+/+ and SRC-3−/− mice (age 7 weeks, n=8) was determined by quantitative RT–PCR. Fold inductions are indicated; (E) SRC-3+/+ and SRC-3−/− T and B cells were transfected with pLXRN-SRC-3 or/and pFlag-CMV-IKK expression plasmids. T cells were stimulated with anti-CD3+anti-CD28 and B cells with anti-IgM+anti-CD40. Proliferation was assessed by [3H]thymidine incorporation 18 h later. Results are presented as mean c.p.m.±s.d. for cells from three individual mice for each condition. **P<0.01 indicates a significant difference compared with T or B cells transfected only with control plasmids.++P<0.01 indicates a significant difference compared with T or B cells transfected only with pFlag-CMV-IKK.
Figure 4
Figure 4
Decreased apoptotic activity in SRC-3−/− mice. Flow cytometric analysis of apoptotic SRC-3+/+ and SRC-3−/− spleen cell suspensions (A) and MEFs (B) after staining by annexin V FITC and propidium iodide (PI). The bar graphs at the bottom of (A) and (B) show the quantification of three independent experiments **P<0.01; (C) mRNA levels of BCL-2, BCL-XL, and c-FLIP in lymphocytes, spleen, and skin of SRC-3+/+ and SRC-3−/− animals (age 7 weeks, n=8) determined by quantitative RT–PCR. *P<0.05, **P<0.01.
Figure 5
Figure 5
SRC-3 controls proliferation and apoptosis in T and B lymphocytes. SRC-3+/+ and SRC-3−/− T cells (A) and B cells (B) were transfected with pLXRN-SRC-3 or pLXRN control plasmid. T and B cells were stimulated, respectively, with anti-CD3+anti-CD28 and anti-IgM+anti-CD40, and then proliferation was assessed by [3H]thymidine incorporation 18 h later. Results in (A) and (B) are presented as mean c.p.m.±s.d. for cells from three individual mice plated in replicates of three for each condition. (C) BCL-2, BCL-XL, and c-FLIP mRNA levels were determined by quantitative RT–PCR in lymphocytes of SRC-3+/+ and SRC-3−/− animals transfected with pLXRN-SRC-3 or pLXRN plasmids. *P<0.05, and **P<0.01 indicate significant difference compared with SRC-3+/+ cells transfected with pLXRN.++P<0.01 indicates a significant difference compared with SRC-3−/− cells transfected with pLXRN.
Figure 6
Figure 6
The lymphoproliferative syndrome in SRC-3−/− mice detoriates with age into malignant lymphoma. (A) WBC and lymphocyte counts of young (2–3 months, n=8) and old mice (11–14 months, n=7); (B) body weight gain in SRC-3+/+ and SRC-3−/− mice; (C) incidence of lymphoma in SRC-3+/+ (n=15) and SRC-3−/− (n=14) mice. Statistical significance (P<0.05; χ2 test) is indicated; (D) percentage of mortality of SRC-3+/+ (n=11) and SRC-3−/− (n=7) mice at 14 months of age. Statistical significance (P<0.01; χ2 test) is indicated; (E) spleen/body weight (BW) ratio of young (3 months, n=8) and old mice (14 months, n=7). *P<0.05; (F) scheme explaining the mechanism leading to the lymphoproliferative syndrome in SRC-3−/− mice. The size of symbols/arrows reflects the relative concentrations of signaling factors.
Figure 7
Figure 7
Ablation of SRC3 results in increased B-cell proliferation and predisposes to B-cell lymphomas. Histological sections through lymph nodes (A–D, I–L), spleen (E–H, Q–T), liver (M, N), and lung (O, P) of SRC3+/+ mice and SRC3−/− mice at 3 (A–H), 11 (I–P), and 14 (Q–T) months of age. (A–D) In young SRC3−/− and SRC3+/+ mice, the germinal centers (white ovals) of lymphoid follicles (green ovals) contain similar mixed populations of proliferative B lymphocyte precursors (CB and CY), mature lymphocytes (B), and macrophages (M). (E–H) Immunohistochemical detection of B cells in the spleen (red signal), showing an increase of their number in both the white pulp (yellow outlines) and the red pulp (R) of the mutants. (J, L, N, P) Follicular B-cell lymphoma with liver and lung metastases; the tumor (displayed in L) consists of a mixture of cells with scant amounts of slightly eosinophilic cytoplasm and large nuclei containing one or two nucleoli (CY), and of smaller basophilic cells with condensed chromatin and inconspicuous nucleoli (B). (I, K, M, O) Tissues from an SRC3+/+ littermate are displayed for comparaison. (R, T) Histiocyte-associated lymphoma consisting of a mixture of large cells (HY) with round nuclei, prominent nucleoli, and abundant eosinophilic cytoplasm, occasionally containing cellular debris, and of small cells with scant amounts of basophilic cytoplasm (B). (Q, S) The spleen of a SRC3+/+ littermate is displayed for comparative purposes. Abbreviations: A, lung alveoli; AD, adipose tissue; B, mature B cells; C, capsules of lymph nodes; CA, central arterioles; CB, centroblasts; CY, centrocytes; F, splenic lymphoid follicles; G, germinal centers of lymphoid follicles; H, hepatocytes; I, lymphoid infiltrates; M, macrophages; P, periphery of lymphoid follicles (mantle zone); PA, periarteriolar lymphoid sheath (main T-cell zone of the spleen); R, red pulp of the spleen; S, marginal sinus; W, white pulp of the spleen. White ovals, limits of germinal centers in lymph nodes; green ovals, limits of follicles in lymph nodes; yellow outlines, limits of the white pulp of the spleen; brackets, marginal zone of the white pulp; arrowheads, tumor cells invading adipose tissue. Hematoxylin and eosin stain (A–D and I–T) and computer generated bright field images of B220 immunodetection (red pseudocolor) with DAPI counterstain (E–H). Bar: 50 μm (A, B), 2.5 μm (C, D), 20 μm (E–L), 145 μm (M–P), 35 μm (Q, R), and 5 μm (S, T).

References

    1. Adams JM, Cory S (1998) The Bcl-2 protein family: arbiters of cell survival. Science 281: 1322–1326 - PubMed
    1. Aggarwal BB (2004) Nuclear factor-kappaB: the enemy within. Cancer Cell 6: 203–208 - PubMed
    1. Anzick SL, Kononen J, Walker RL, Azorsa DO, Tanner MM, Guan X-Y, Sauter G, Kallioniemi OP, Trent JM, Meltzer PS (1997) AIB1, a steroid receptor coactivator amplified in breast and ovarian cancer. Science 277: 965–968 - PubMed
    1. Carpinelli MR, Hilton DJ, Metcalf D, Antonchuk JL, Hyland CD, Mifsud SL, Di Rago L, Hilton AA, Willson TA, Roberts AW, Ramsay RG, Nicola NA, Alexander WS (2004) Suppressor screen in Mpl−/− mice: c-Myb mutation causes supraphysiological production of platelets in the absence of thrombopoietin signaling. Proc Natl Acad Sci USA 101: 6553–6558 - PMC - PubMed
    1. Chen H, Lin RJ, Schiltz L, Chakravarti D, Nash A, Nagy L, Privalsky ML, Nakatani Y, Evans RM (1997) Nuclear receptor coactivator ACTR is a novel histone acetyltransferase and forms multimeric activation complexes with P/CAF and CBP/p300. Cell 90: 569–580 - PubMed

Publication types

MeSH terms