. 2006 Mar-Apr;8(3-4):506-16.
doi: 10.1089/ars.2006.8.506.

Frataxin, iron-sulfur clusters, heme, ROS, and aging

Affiliations

Frataxin, iron-sulfur clusters, heme, ROS, and aging

Eleonora Napoli et al. Antioxid Redox Signal. 2006 Mar-Apr.

Abstract

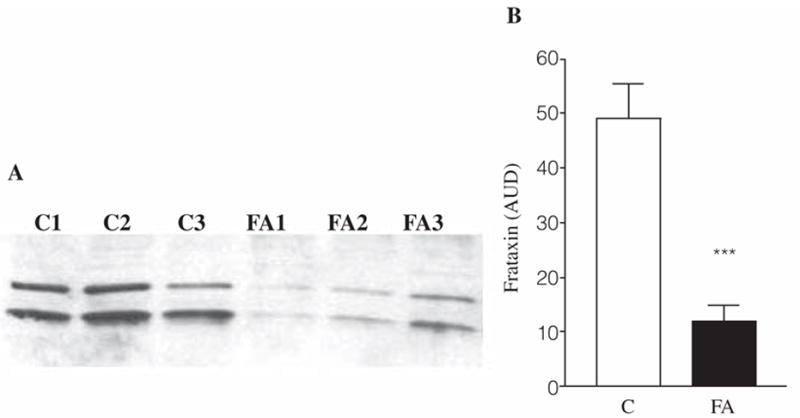
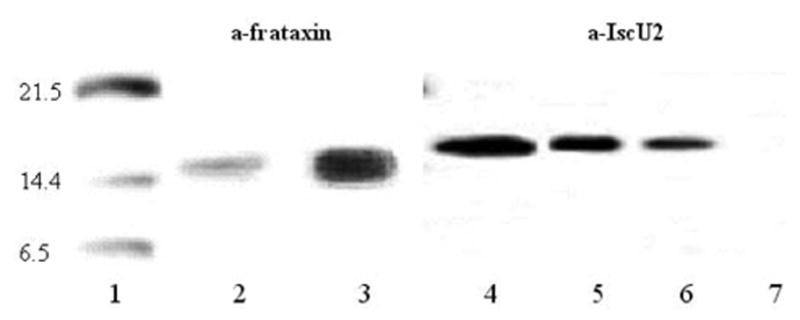
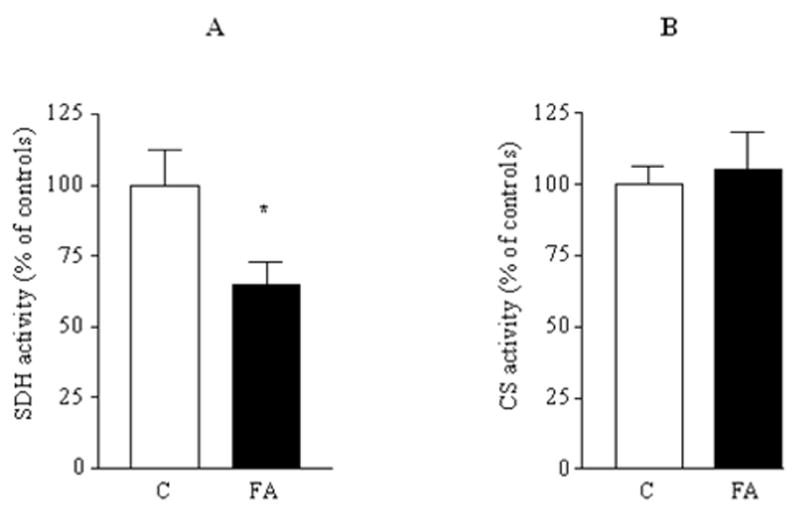
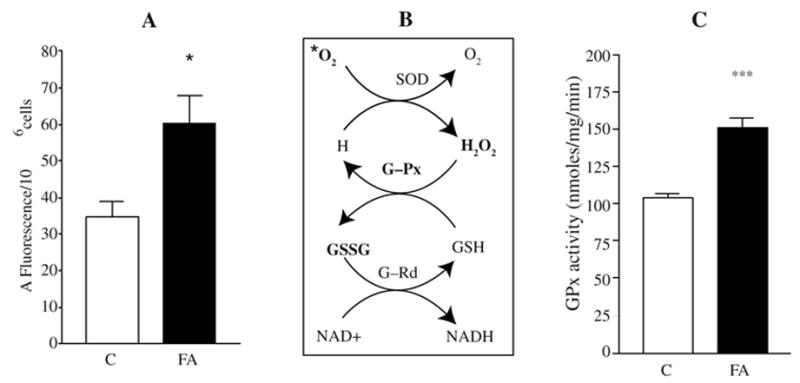
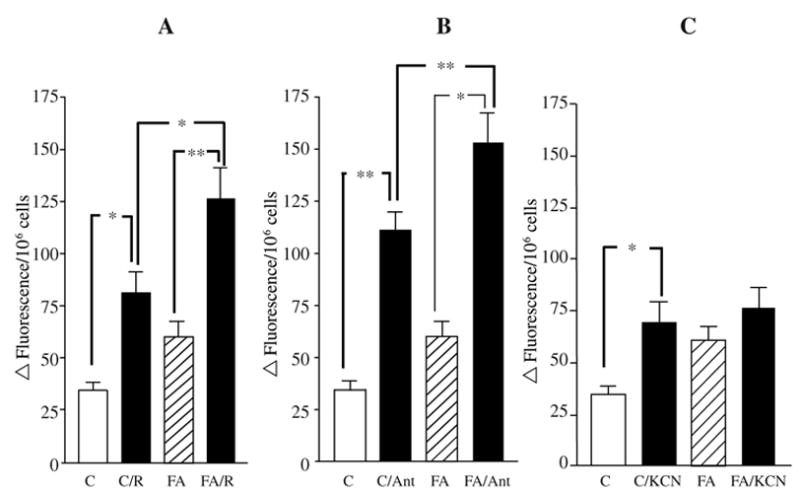
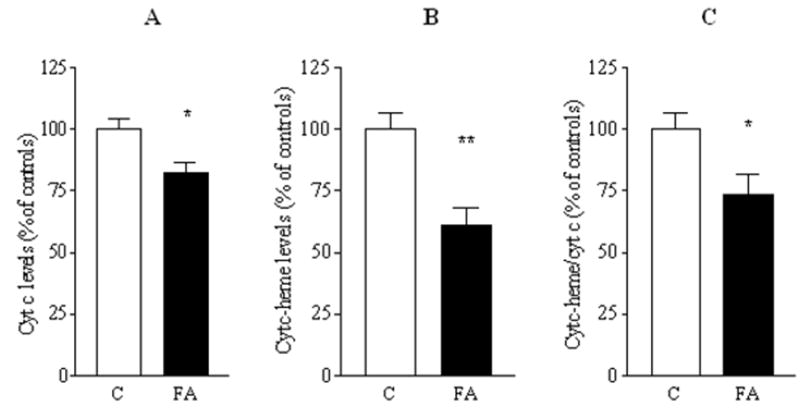
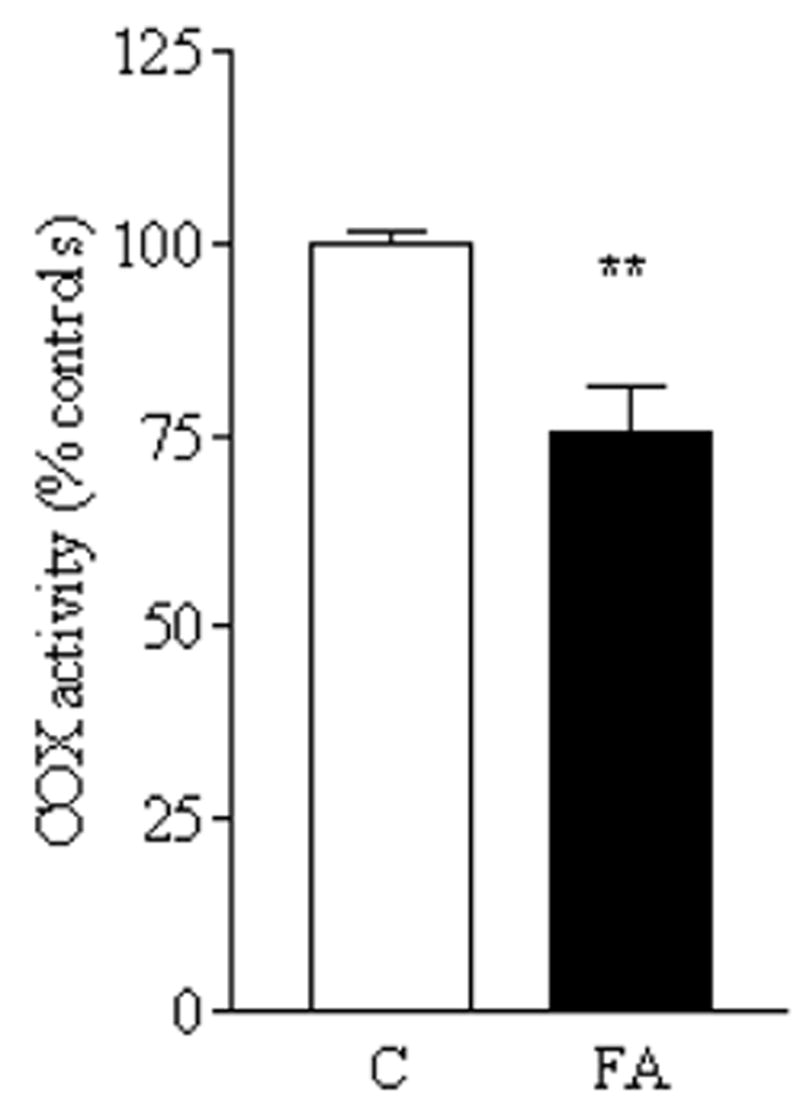
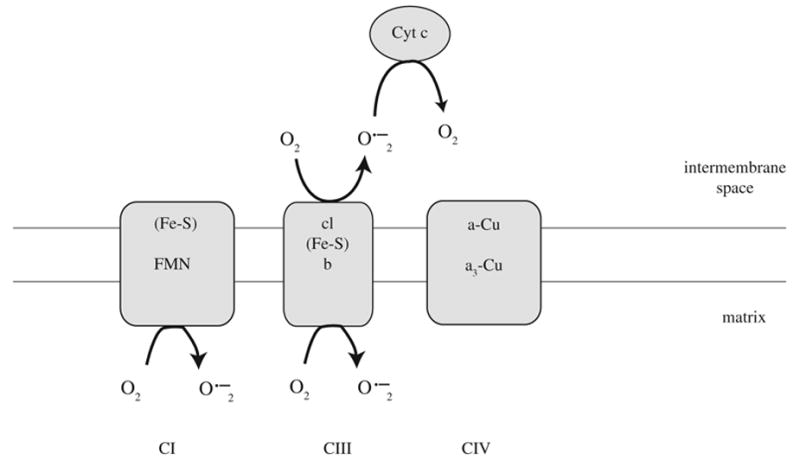
A deficiency in mitochondrial frataxin causes an increased generation of mitochondrial reactive oxygen species (ROS), which may contribute to the cell degenerative features of Friedreich's ataxia. In this work the authors demonstrate mitochondrial iron-sulfur cluster (ISC) defects and mitochondrial heme defects, and suggest how both may contribute to increased mitochondrial ROS in lymphoblasts from human patients. Mutant cells are deficient in the ISC-requiring mitochondrial enzymes aconitase and succinate dehydrogenase, but not in the non-ISC mitochondrial enzyme citrate synthase; also, the mitochondrial iron-sulfur scaffold protein IscU2 co-immunoprecipitates with frataxin in vivo. Presumably as a consequence of the iron-sulfur cluster defect, cytochrome c heme is deficient in mutants, as well as heme-dependent Complex IV. Mitochondrial superoxide is elevated in mutants, which may be a consequence of cytochrome c deficiency. Hydrogen peroxide, glutathione peroxidase activity, and oxidized glutathione (GSSG) are each elevated in mutants, consistent with activation of the glutathione peroxidase pathway. Mutant status blunted the effects of Complex III and IV inhibitors, but not a Complex I inhibitor, on superoxide production. This suggests that heme defects late in the electron transport chain of mutants are responsible for increased mutant superoxide. The impact of ISC and heme defects on ROS production with age are discussed.


Figures

FIG. 1
FIG. 1. Frataxin amount in controls and FRDA lymphoblasts
(A) Example of Western blot with anti-frataxin antibody (1:3000 dil) on three control and three FRDA mitochondrial lysates (30 μg). Both the intermediate (~18.8 KDa) and the mature (~17.2 KDa) form of frataxin are shown. The band intensities were analyzed by densitometry and the averages of six different controls and six different FRDA mitochondrial lysates were calculated (B). Results are expressed as means ± SEM of two experiments in duplicate for each cell line. AUD, arbitrary units of densitometry; C, controls; FA, Friedreich’s ataxia mutants. ***p < 0.001 calculated by Student’s t test.
FIG. 2
FIG. 2. Co-immunoprecipitation of mitochondrial lysate with anti-frataxin antibody
Two aliquots of the immunocomplex obtained in absence of EDTA were separated from the beads, analyzed by SDS-PAGE and subsequent immunostaining with anti-frataxin antibody (lane 3) and with anti-ISCU2 antibody (lane 5). 1 mg of mitochondrial extracts containing 1 mM EDTA (lane 6) or 10 mM EDTA (lane 7) were immunoprecipitated with anti-frataxin antibody, analyzed by SDS-PAGE, and immunoblotted with anti-IscU2 antibody. 25 μg of total mitochondrial protein (lines 2 and ) were loaded as positive control. Lane 1: molecular weight standard.
FIG. 3
FIG. 3. Succinate dehydrogenase (SDH) activity, but not citrate synthase (CS) activity, is lower in FRDA mitochondria
(A) SDH activity was measured in mitochondrial lysates from two controls and two FRDA mutant lymphoblasts. (B) Citrate synthase activity was measured in isolated mitochondria from three control and three FRDA cell lines following the reduction of DTNB at 412 nm. Both the activities were calculated as nmol/mg/min and the results (expressed as means ± SEM) reported as % of controls average. Statistical analysis was performed by Student’s t test. *p < 0.05.
FIG. 4
FIG. 4. Superoxide production and glutathione peroxidase activity in control and FRDA patient lymphoblasts
(A) Lymphoblasts from two controls and two FRDA mutants were incubated with 2 μM DHE (dihydroethidium), a fluorescent probe specific for superoxide anion detection. Superoxide production was recorded after 120 min at 37°C and expressed as ΔFluorescence/106 cells. (B) GSH-dependent detoxifying mechanism of superoxide; significantly increased reactants or products are in bold. (C) Total GPx activity was measured by the coupled enzyme procedure with glutathione reductase. The results are expressed as means ± SEM of at least two experiments in duplicate for two controls and two FRDA cell lines. C, controls; FA, Friedreich’s ataxia mutants. Statistical analysis was done by Student’s t test using the Prism Graph Pad software. *p < 0.05, ***p < 0.0001.
FIG. 5
FIG. 5. Superoxide production in controls and FRDA patient lymphoblasts
Lymphoblasts from two controls and two FRDA mutants were incubated with 2 μM DHE. Preincubation with 10 μM of rotenone (A), which specifically inhibits complex I activity, increased the superoxide levels in both controls and FRDAs. Treatment of mutants with 10 μM antimycin a (B), complex III inhibitor, produces a blunted superoxide response. Treatment of mutants with 0.5 mM of KCN (C), complex IV inhibitor, does not significantly increase superoxide production in FRDA lymphoblasts. Data are reported as means ± SEM of at least 10 experiments in duplicate for controls and 12 for FRDA mutants. Ant, antimycin a; C, controls; FA, Friedreich’s ataxia mutants; R, rotenone. Statistical analysis was done by one-way ANOVA followed by Bonferroni’s multiple comparison post test. *p < 0.05, **p < 0.001.
FIG. 6
FIG. 6. Depletion of cytochrome c and heme c in FRDA mitochondria
(A) Cytochrome c levels were analyzed by Western blot followed by densitometry. (B) Cytochrome c specific heme content was analyzed by the o-dianisidine staining as described in Materials and Methods. (C) Heme c/cytochrome c ratio. The results are reported as means ± SEM of eight experiments in duplicate for controls and FRDA and expressed as band intensities normalized as a percent of controls. C, controls; FA, Friedreich’s ataxia mutants. Statistical analysis by Student’s t test. *p < 0.05, **p < 0.005.
FIG. 7
FIG. 7. Complex IV activity is impaired in FRDA lymphoblasts
Cytochrome c oxidase activity was measured as described in Materials and Methods and expressed as nmol/mg/min. The bar graph shows the means ± SEM of four experiments in duplicate for controls (C) and FRDA (FA) reported as percentage of controls. Statistical analysis done by Student’s t test. **p < 0.005.
FIG. 8
FIG. 8
Mechanism of cytochrome c-dependent superoxide detoxification.

References

    1. Ames BN, Shigenaga MK, Hagen TM. Oxidants, antioxidants, and the degenerative diseases of aging. Proc Natl Acad Sci USA. 1993;90:7915–7922. - PMC - PubMed
    1. Atamna H, Liu J, Ames BN. Heme deficiency selectively interrupts assembly of mitochondrial complex IV in human fibroblasts: revelance to aging. J Biol Chem. 2001;276:48410–48416. - PubMed
    1. Atamna H, Killilea DW, Killilea AN, Ames BN. Heme deficiency may be a factor in the mitochondrial and neuronal decay of aging. Proc Natl Acad Sci USA. 2002;99:14807–14812. - PMC - PubMed
    1. Bidichandani SI, Purandare SM, Taylor EE, Gumin G, Machkhas H, Harati Y, Gibbs RA, Ashizawa T, Patel PI. Somatic sequence variation at the Friedreich ataxia locus includes complete contraction of the expanded GAA triplet repeat, significant length variation in serially passaged lymphoblasts and enhanced mutagenesis in the flanking sequence. Hum Mol Genet. 1999;8:2425–2436. - PubMed
    1. Birch-Machin MA, Turnbull DM. Assaying mitochondrial respiratory complex activity in mitochondria isolated from human cells and tissues. Methods Cell Biol. 2001;65:97–117. - PubMed

Publication types