. 2006 May 5:7:247.
doi: 10.1186/1471-2105-7-247.

Bayesian models for pooling microarray studies with multiple sources of replications

Affiliations

Bayesian models for pooling microarray studies with multiple sources of replications

Erin M Conlon et al. BMC Bioinformatics. .

Abstract

Background: Biologists often conduct multiple but different cDNA microarray studies that all target the same biological system or pathway. Within each study, replicate slides within repeated identical experiments are often produced. Pooling information across studies can help more accurately identify true target genes. Here, we introduce a method to integrate multiple independent studies efficiently.

Results: We introduce a Bayesian hierarchical model to pool cDNA microarray data across multiple independent studies to identify highly expressed genes. Each study has multiple sources of variation, i.e. replicate slides within repeated identical experiments. Our model produces the gene-specific posterior probability of differential expression, which provides a direct method for ranking genes, and provides Bayesian estimates of false discovery rates (FDR). In simulations combining two and five independent studies, with fixed FDR levels, we observed large increases in the number of discovered genes in pooled versus individual analyses. When the number of output genes is fixed (e.g., top 100), the pooled model found appreciably more truly differentially expressed genes than the individual studies. We were also able to identify more differentially expressed genes from pooling two independent studies in Bacillus subtilis than from each individual data set. Finally, we observed that in our simulation studies our Bayesian FDR estimates tracked the true FDRs very well.

Conclusion: Our method provides a cohesive framework for combining multiple but not identical microarray studies with several sources of replication, with data produced from the same platform. We assume that each study contains only two conditions: an experimental and a control sample. We demonstrated our model's suitability for a small number of studies that have been either pre-scaled or have no outliers.


Figures

Figure 1
Figure 1
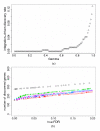
IDR and discovered genes versus tFDR for the two-study simulation data. a) Integration-driven discovery rate (IDR) versus threshold values of posterior probabilities of differential expression, γ, for the two-study simulated data and percent of differentially expressed genes p = 5% (blue checks), 10% (black diamonds), 25% (red triangles); b) The maximum number of differentially expressed genes versus true false discovery rate (tFDR) for individual analyses of Study 1 (red triangles), Study 2 (blue checks) and pooled analysis (black diamonds), for two-study simulated data and percent of differentially expressed genes p = 10%.
Figure 2
Figure 2
True false discovery rate versus posterior expected false discovery rate for the simulation data. True false discovery rate (tFDR) (solid lines) and posterior expected false discovery rate (peFDR) (dashed lines) versus the number of discovered genes for: a) two-study simulation data, p = 5%; b) two-study simulation data, p = 10%; c) two-study simulation data, p = 25%; d) five-study simulation data, p = 10%.
Figure 3
Figure 3
IDR and discovered genes versus tFDR for the five-study simulation data. a) Integration-driven discovery rate (IDR) versus threshold values of posterior probabilities of differential expression, γ, for the five-study simulated data and percent of differentially expressed genes p = 10%; b) The maximum number of differentially expressed genes versus true false discovery rate (tFDR) for individual analyses of Study 1 (red triangles), Study 2 (blue checks), Study 3 (green stars), Study 4 (turquoise circles), Study 5 (pink inverted triangles) and pooled analysis (black diamonds), for five-study simulated data and percent of differentially expressed genes p = 10%.
Figure 4
Figure 4
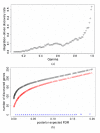
IDR and discovered genes versus peFDR for the experimental data. a) Integration-driven discovery rate (IDR) versus threshold values of posterior probabilities of differential expression, γ, for the B. subtilis mutant and induction experimental study data; b) The maximum number of differentially expressed genes versus posterior expected false discovery rate (peFDR) for individual analyses of the B. subtilis mutant study (red triangles), induction study (blue checks) and pooled analysis (black diamonds).

References

    1. Baldi P, Long AD. Bayesian framework for the analysis of microarray expression data: reguralized t-test and statistical inferences of gene changes. Bioinformatics. 2001;17:509–519. doi: 10.1093/bioinformatics/17.6.509. - DOI - PubMed
    1. Tseng GC, Oh MK, Rohlin L, Liao JC, Wong WH. Issues in cDNA microarray analysis: quality filtering, channel normalization, models of variations and assessment of gene effects. Nucleic Acids Res. 2001;29:2549–2557. doi: 10.1093/nar/29.12.2549. - DOI - PMC - PubMed
    1. Townsend JP, Hartl DL. Bayesian analysis of gene expression levels: statistical quantification of relative mRNA level across multiple treatments or samples. Genome Biology. 2002;3:research0071.1–71.16. doi: 10.1186/gb-2002-3-12-research0071. - DOI - PMC - PubMed
    1. Efron B, Tibshirani R, Storey JD, Tusher VG. Empirical Bayes Analysis of a Microarray Experiment. Journal of the American Statistical Association. 2001;96:1151–1160. doi: 10.1198/016214501753382129. - DOI
    1. Newton MA, Kendziorski CM, Richmond CS, Blattner FR, Tsui KW. On Differential Variability of Expression Ratios: Improving Statistical Inference About Gene Expression Changes From Microarray Data. Journal of Computational Biology. 2001;8:37–52. doi: 10.1089/106652701300099074. - DOI - PubMed

Publication types

MeSH terms

LinkOut - more resources