. 2006 Jul;141(3):988-99.
doi: 10.1104/pp.106.079707. Epub 2006 May 5.

PHO2, microRNA399, and PHR1 define a phosphate-signaling pathway in plants

Affiliations

PHO2, microRNA399, and PHR1 define a phosphate-signaling pathway in plants

Rajendra Bari et al. Plant Physiol. 2006 Jul.

Abstract

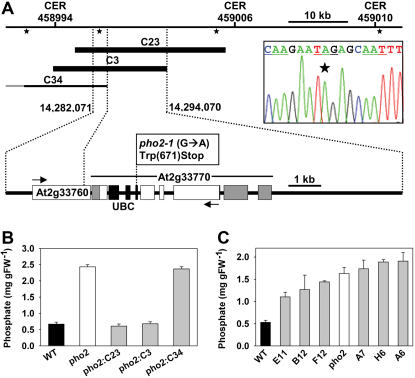
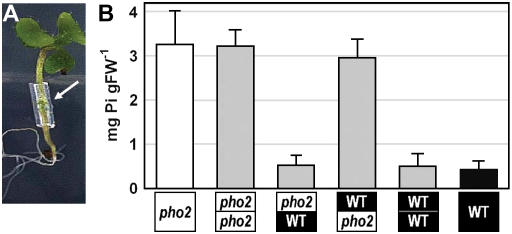
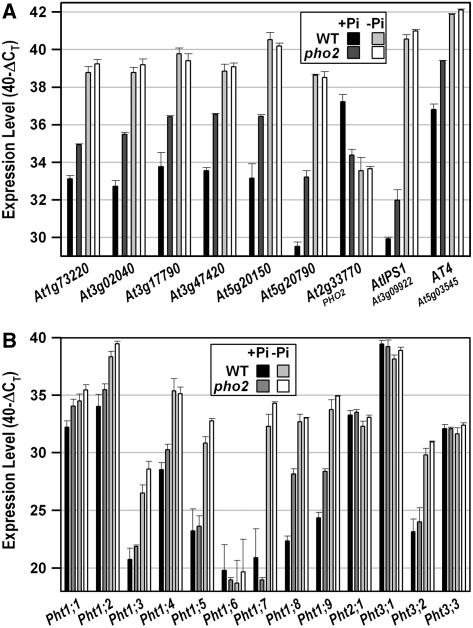
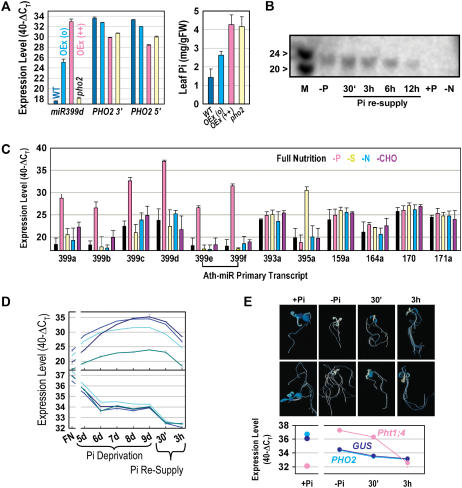
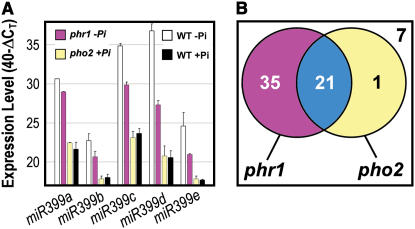
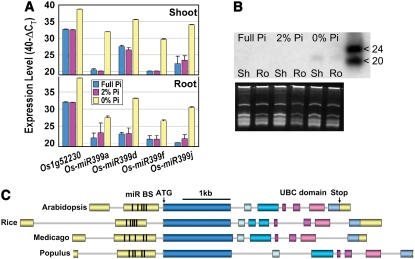
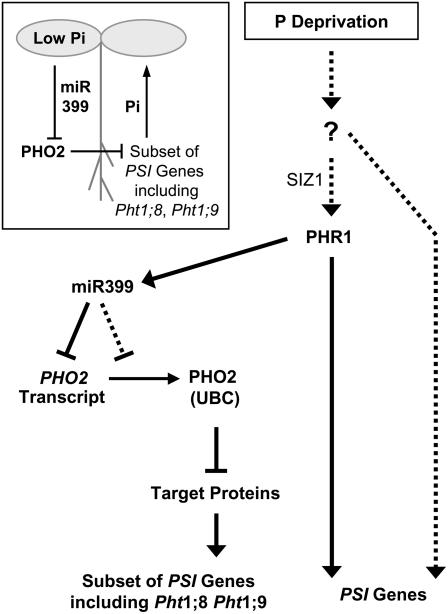
Inorganic phosphate (Pi)-signaling pathways in plants are still largely unknown. The Arabidopsis (Arabidopsis thaliana) pho2 mutant overaccumulates Pi in leaves in Pi-replete conditions. Micrografting revealed that a pho2 root genotype is sufficient to yield leaf Pi accumulation. In pho2 mutants, Pi does not repress a set of Pi starvation-induced genes, including AtIPS1, AT4, and Pi transporters Pht1;8 and Pht1;9. Map-based cloning identified PHO2 as At2g33770, an unusual E2 conjugase gene. It was recently shown that Pi deprivation induces mature microRNA (miRNA [miR399]) and that overexpression of miR399 in Pi-replete conditions represses E2 conjugase expression and leads to high leaf Pi concentrations, thus phenocopying pho2. We show here that miR399 primary transcripts are also strongly induced by low Pi and rapidly repressed after addition of Pi. PHO2 transcripts change reciprocally to miR399 transcripts in Pi-deprived plants and in miR399 overexpressers. However, responses after Pi readdition and in beta-glucuronidase reporter lines suggest that PHO2 expression is also regulated by Pi in a manner unrelated to miR399-mediated transcript cleavage. Expression of miR399 was strongly reduced in Pi-deprived Arabidopsis phr1 mutants, and a subset of Pi-responsive genes repressed in Pi-deprived phr1 mutants was up-regulated in Pi-replete pho2 mutants. This places miR399 and PHO2 in a branch of the Pi-signaling network downstream of PHR1. Finally, putative PHO2 orthologs containing five miR399-binding sites in their 5'-untranslated regions were identified in other higher plants, and Pi-dependent miR399 expression was demonstrated in rice (Oryza sativa), suggesting a conserved regulatory mechanism.


Figures

Figure 1.
Figure 1.
Identification of PHO2. A, View of the approximately 50-kb mapping interval determined by CER458994 and CER459010 (compare with Supplemental Fig. 1). The positions of hybridization probes for cosmid library screening are shown as asterisks and three clones (C23, C3, and C34) are depicted as black bars, with the complementing clones C23 and C3 in bold. An expanded blow-up shows the structure of the two annotated genes (At2g33760 and At2g33770) within a 12-kb segment harboring PHO2. Arrows indicate the direction of transcription, exons are depicted as white boxes, and UTRs of PHO2 (At2g33770) as gray boxes. The UBC domain of At2g33770 is shaded in black. The point mutation in the pho2-1 and pho2-2 alleles (G→A; electropherogram) causes an early amber stop codon at the beginning of UBC. B, Leaf Pi levels in wild type (black), pho2 mutant (white), and complemented (C23, C3) and noncomplemented (C34) pho2 mutants (gray; mean ± sd; n = 5). C, Leaf Pi levels in wild type (black bar), pho2 mutant (white bar), and wild type transformed with a PHO2 RNAi construct (gray bars; mean ± sd; n = 3).
Figure 2.
Figure 2.
Reciprocal micrografting of a pho2 mutant and wild type. A, Aspect of a 14-d-old micrografted Arabidopsis seedling. B, Leaf Pi levels in wild type (black), pho2 mutant (white), and reciprocally grafted chimeric seedlings (gray; mean value ± sd; n = 6).
Figure 3.
Figure 3.
Molecular phenotypes of Pi-replete pho2 mutant roots. Transcript levels of nine selected P-responsive genes (A) and of 13 genes encoding phosphate transporters (B) are shown. Both images compare transcript levels in pho2 mutant roots and wild-type roots grown in Pi-replete or Pi-deprived conditions. Expression levels are given on a log scale expressed as 40 − ΔCT, where ΔCT is the difference in qRT-PCR threshold cycle number between the respective gene and the reference gene (UBQ10; At4g05320); 40 therefore equals the expression level of UBQ10; the number 40 was chosen because the PCR run stops after 40 cycles. The fold difference in expression is 2ΔΔCT when PCR efficiency is 2 (e.g. an ordinate value of 34 represents 16-fold lower expression than a value of 38). The results are the mean ± sd of four biological replicates.
Figure 4.
Figure 4.
Regulation of PHO2 via Pi deprivation induced miR399. A, Impact of overexpression of miR399d on PHO2 leaf transcript level (left) and leaf Pi (right). Results are shown for wild type, pho2 mutant, moderate (o), and strong (++) overexpressers. The results are from leaves of 4-week-old soil-grown plants and show the mean ± sd of five biological replicates or five transgenic lines. PHO2 3′ and PHO2 5′ are designators for qRT-PCR products amplified from the 3′ and 5′ regions of the cDNA (compare with Supplemental Table III, primer pairs At2g33770_4 and At2g33770_5). B, Northern blot of the response of mature miR399 species in whole seedlings in full nutrition (+P), after Pi deprivation (−P) and 30-min to 12-h Pi resupply, and in nitrogen limitation (−N). The marker (M) is a mixture of 20- and 24-mer ribonucleotides. C, Levels of miRNA PTs in whole seedlings grown in full nutrition or Pi, sulfur, nitrogen, or carbohydrate limitation (P, S, N, and CHO, respectively). Results are shown for miR399a, miR399b, miR399c, miR399d, miR399e, and miR399f (the latter two are bracketed as they are encoded by the same gene), miR393a (previously shown to be stress responsive; see text), miR395a (previously shown to be S responsive; see text), and four miRNAs with developmental functions (159a, 164a, 170, and 171a). D, Time course of miR399 PT expression levels (top; miR399d, c, a, and e from the top at day 9) and PHO2 transcript level (bottom; analyzed with four different primer pairs as shown in Supplemental Fig. 4B) in wild-type seedlings during the development of Pi deprivation and after Pi resupply. E, Analysis of expression in reporter gene lines expressing GUS under control of an approximately 1.8-kb PHO2 upstream sequence. Two representative seedlings are shown for each condition. The transcript levels of PHO2, GUS, and Pht1;4 were determined by qRT-PCR in the same materials. The results in B to E are from seedlings grown in liquid culture in full nutrient (FN) medium for 9 d or were transferred after 7 d from FN to conditions in which a particular nutrient is missing, kept there for 2 d, and then resupplied with the respective nutrient (Scheible et al., 2004). Seedlings were harvested from full nutrition conditions, 2 d of P deprivation (−P), and 30 min (30′) and 3 h (3 h) after resupply of 0.5 mm KPi, or after 2 d of S, N, or CHO limitation. In D, 5-d-old seedlings were transferred to Pi depletion and Pi was added back 4 d later. For all qRT-PCR analyses, expression levels are given on a log scale as described in the legend to Figure 3.
Figure 5.
Figure 5.
PHR1 acts upstream of PHO2. A, qRT-PCR expression levels of miR399 PTs in Pi-deprived phr1 mutant seedlings, in Pi-deprived and Pi-replete wild-type seedlings, and in Pi-replete pho2 mutant seedlings. Expression levels are given as described in the legend to Figure 3. B, Venn diagram showing the overlap in the response of 64 Pi-responsive gene transcripts in phr1 mutants and pho2 mutants. Detailed results for all transcripts are shown in Supplemental Figure 6.
Figure 6.
Figure 6.
Conservation of PHO2 genes and induction of miR399 by Pi starvation in higher plants. A, Expression levels of Pi starvation marker gene Os1g52230 (putative acid phosphatase homologous to the strongly Pi starvation-induced At1g17710), and Os-miR399a, d, f, and j PTs in shoots and roots of rice. The results are given as described in the legend to Figure 3. The reference gene was β-tubulin (Os1g59150). Colors represent the Pi concentrations in the external medium (full Pi, 320 μm, 2% Pi, 6.4 μm). B, Northern blot (top) showing the induction of mature Os-miR399 in shoots (Sh) and roots (Ro) of rice grown in the absence of external Pi. The bottom image shows the RNA gel used for blotting. C, Gene structures of AtPHO2 and potential orthologs from rice (Os5g48390), M. truncatula, and poplar. Gene structures are drawn to scale. UTRs are shaded yellow and coding regions are shown in shades of blue and red. The black ticks in the second exon depict the position of the five miR399-binding sites (miR BS).
Figure 7.
Figure 7.
A model for plant Pi signaling involving PHO2, miR399, and PHR1. Expression of a subset of phosphate starvation-induced (PSI) genes, including the Pi transporter genes Pht1;8 and Pht1;9, is regulated through the UBC protein PHO2. Expression of PHO2 is regulated by miR399 species, which in turn require PHR1 for induction. PHR1 is also important for PHO2-independent expression of other PSI genes, and SIZ1-dependent sumoylation might be required for PHR1 activity. Other parts of the transcriptional response of plants to Pi deprivation might be PHR1 independent (dashed arrows). The inset illustrates the hypothesis that miR399 might serve as a mobile signal allowing coordinated responses to Pi stress between different parts of the plant.

Comment in

References

    1. Abel S, Ticconi CA, Delatorre CA (2002) Phosphate sensing in higher plants. Physiol Plant 115: 1–8 - PubMed
    1. Allen E, Xie Z, Gustafson AM, Carrington JC (2005) microRNA-directed phasing during trans-acting siRNA biogenesis in plants. Cell 121: 207–221 - PubMed
    1. Bläsing OE, Gibon Y, Günther M, Hohne M, Morcuende R, Osuna D, Thimm O, Usadel B, Scheible WR, Stitt M (2005) Sugars and circadian regulation make major contributions to the global regulation of diurnal gene expression in Arabidopsis. Plant Cell 17: 3257–3281 - PMC - PubMed
    1. Bolstad BM, Irizarry RA, Astrand M, Speed TP (2003) A comparison of normalization methods for high density oligonucleotide array data based on variance and bias. Bioinformatics 19: 185–193 - PubMed
    1. Chen DL, Delatorre CA, Bakker A, Abel S (2000) Conditional identification of phosphate-starvation-response mutants in Arabidopsis thaliana. Planta 211: 13–22 - PubMed

Publication types

MeSH terms