. 2006 Jun;18(6):1510-23.
doi: 10.1105/tpc.105.035121. Epub 2006 May 5.

The Galpha protein controls a pH-dependent signal path to the induction of phytoalexin biosynthesis in Eschscholzia californica

Affiliations

The Galpha protein controls a pH-dependent signal path to the induction of phytoalexin biosynthesis in Eschscholzia californica

Katrin Viehweger et al. Plant Cell. 2006 Jun.

Abstract

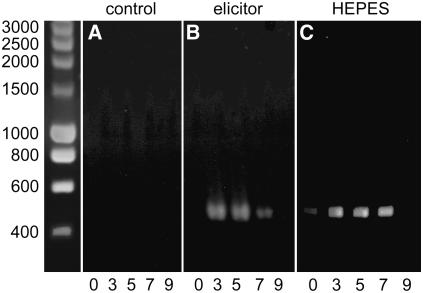
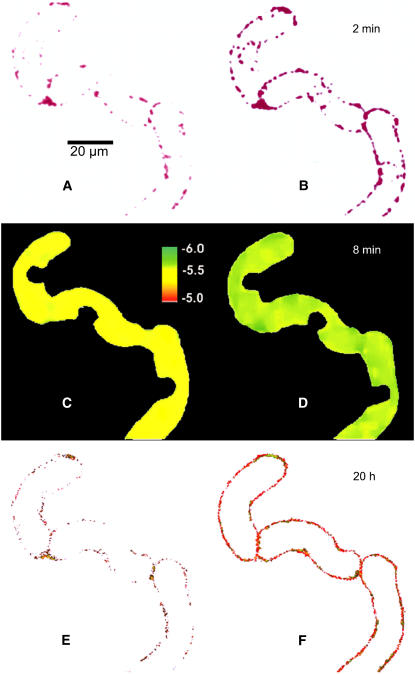
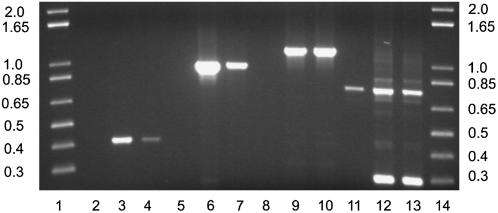
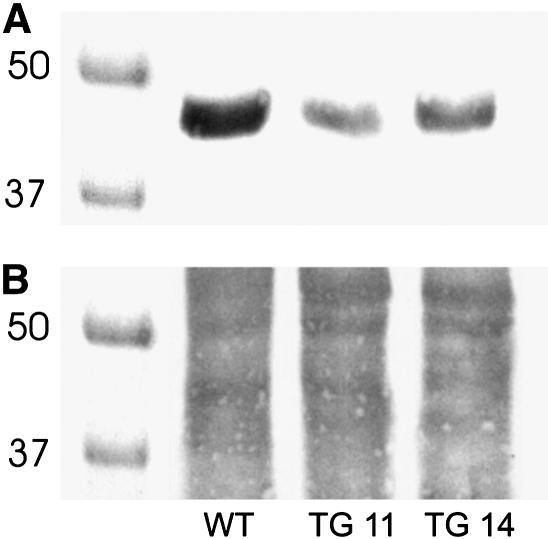
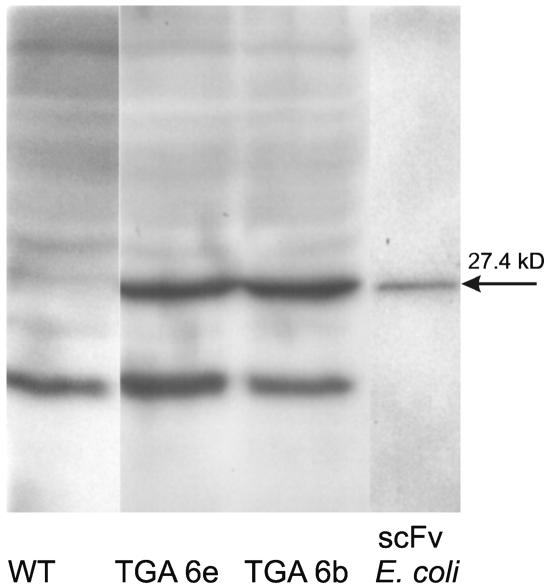
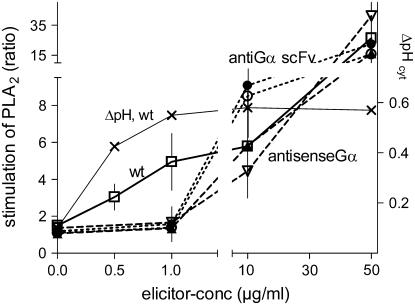
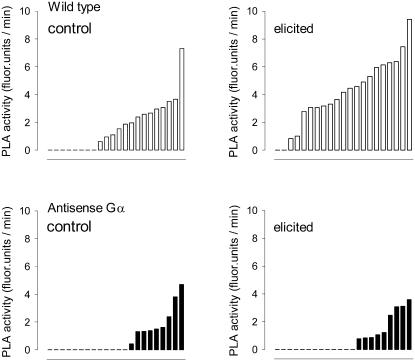
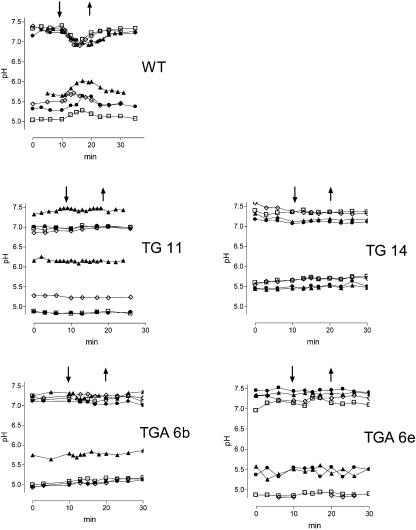
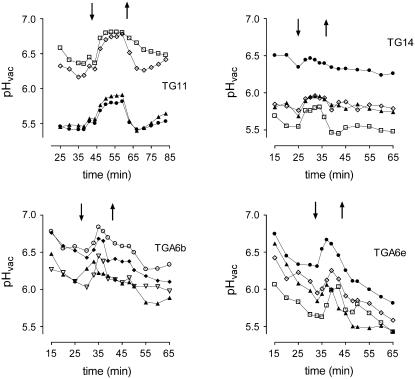
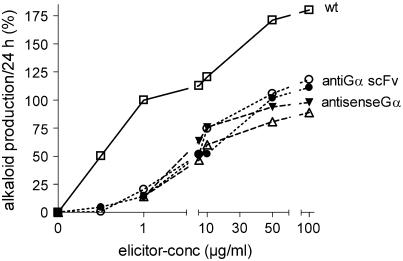
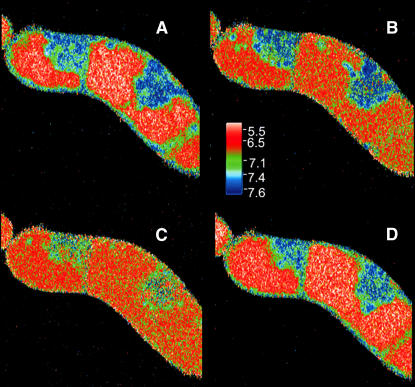
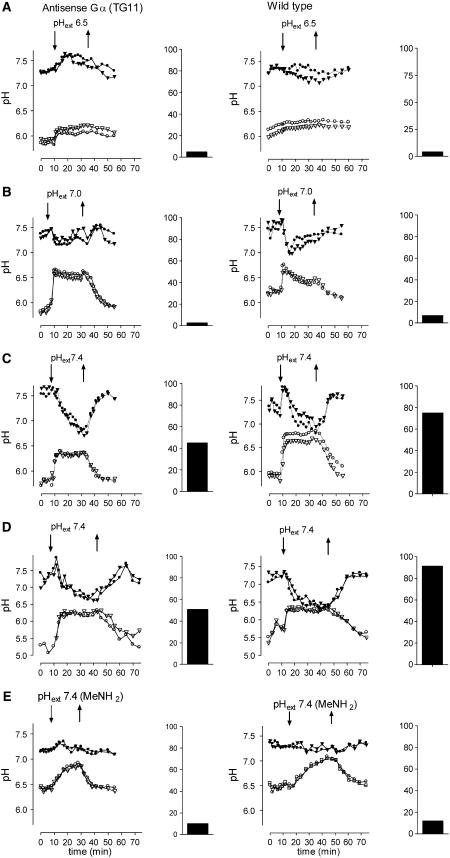
The function of a Galpha protein in the elicitation of phytoalexin (benzophenanthridine) biosynthesis was characterized in cultured cells of California poppy (Eschscholzia californica). Both the decrease of Galpha content via antisense transformation and the expression of recombinant anti-Galpha single-chain antibodies strongly impaired the induction of alkaloid biosynthesis by low elicitor concentrations. All transgenic cell types were deficient in two elicitor-triggered early signal events: activation of phospholipase A2 (PLA2) and efflux of vacuolar protons. The lacking H+ efflux could be restored (1) by adding lysophosphatidylcholine (LPC), a product of PLA2 activity, to vacuoles in situ and (2) by exposing intact cells to isotonic, near-neutral HEPES buffers. The latter treatment induced alkaloid biosynthesis in the absence of elicitor and in Galpha-deficient cells. We conclude that Galpha mediates the stimulation of PLA2 by low elicitor concentrations and that the resulting peak of LPC initiates a transient efflux of vacuolar protons. In this way, an acidic peak of the cytoplasmic pH is generated that causes the expression of enzymes of phytoalexin production independent of the hypersensitive response.


Figures

Figure 1.
Figure 1.
Expression Analysis of the BBE mRNA by RT-PCR. DNA agarose electrophoresis showing a 456-bp fragment of the BBE gene as amplified from RNA of wild-type cells by RT-PCR (see Methods). The RNA was extracted at 0, 3, 5, 7, or 9 h after a 30-min treatment with 1-μg/mL elicitor (B) or 60 mM HEPES buffer, pH 7.4 (C). Nonstimulated cells are shown in (A). Size calibration of DNA fragments is at left (SmartLadder; Eurogentec). Data from one typical experiment are displayed. The result was confirmed by two repetitions. Similar experiments were performed with RNA from the transformed cell lines TG11, TG14 (antisense Gα), TGA6b, or TGA6e (anti-Gα-scFv). In these cultures, no elicitor-triggered increase of BBE mRNA could be detected. Because most transformants, like nonstimulated wild-type cultures, produce small amounts of alkaloids, the levels of BBE mRNA in these cells are supposed to stay below the detection limit.
Figure 2.
Figure 2.
Increase of PLA2 Activity, Vacuolar pH Shifts, and Alkaloid Production in the Same Cell after Elicitor Contact. Confocal images scanned immediately after addition of 1 μg/mL of yeast elicitor (t = 0, left) and after the times indicated (right). (A) and (B) Stimulation of PLA2 visualized as the elicitor-triggered increase of fluorescence during incubation with the artificial substrate bis-BODIPY-FL-C11-phosphatidylcholine (BPC). For better visibility, the original yellow-green fluorescence was converted into magenta. (C) and (D) pH maps of the vacuolar areas (ratio images of DM-NERF fluorescence). (E) and (F) Fluorescence of benzophenanthridines at emission of 580 to 630 nm. For better visibility, the fluorescence of DM-NERF (emission 535 to 555 nm) that resided in the vacuoles was subtracted. The series is a typical example out of 89 images of alkaloid-producing cells that were examined from different culture batches. For details, see Methods.
Figure 3.
Figure 3.
PCR Reactions to Confirm Antisense Gα Transformation of E. californica Cells. DNA agarose electrophoresis of PCR products. Lanes 1 and 14 contain marker DNA (1-kb plus DNA ladder; Gibco BRL). The lengths of expected and found PCR products are specified in Table 1. This experiment was done with DNA extracted from the cell line TG11. DNA from the cell line TG14 yielded the same results.
Figure 4.
Figure 4.
Immunological Detection of Gα in the Plasma Membrane. Proteins were extracted from isolated plasma membranes with SDS, separated by SDS-PAGE, blotted onto nitrocellulose membranes, and probed with anti-Gα antibodies as described previously (Roos et al., 1999). Gα bands obtained from wild-type and antisense Gα lines TG11 and TG14 are shown in (A). Each lane received similar amounts of solubilized protein as demonstrated by fast green protein staining of the same blot (B). The relative content of Gα in relation to the wild type was estimated at 15% in TG11 and at 24% in TG14 cells, based on a densitometric evaluation of the digitized spots.
Figure 5.
Figure 5.
Immunological Detection of Anti-Gα-scFv Antibodies. The proteins of the 90,000g supernatant obtained during cell fractionation (Roos et al., 1999) were separated by SDS-PAGE, blotted onto nitrocellulose membranes, and probed with anti-cMyc antibodies (Santa Cruz Biotechnology). TGA6a and TGA6b, cell lines transformed by anti-Gα-scFv-cMyc DNA; rightmost lane, protein extract of the transformed Escherichia coli strain HB 2151 used in the production of anti-Gα-scFv-cMyc antibody (see Methods). The scFv-cMyc band is of the predicted size (27.4 kD); the lower band represents an unknown cross-reacting plant protein. Prior to analysis, all samples were assayed by the Bradford method and diluted to equal protein contents.
Figure 6.
Figure 6.
PLA2 Activity of Wild-Type and Transformed Cell Suspensions. Suspensions of wild-type and transformed cell lines were incubated with the fluorogenic substrate BPC and yeast elicitor at the indicated concentrations in microplate compartments (see Methods). The fluorescence development resulting from PLA2 activity is averaged from three experiments with different culture batches, each comprising 48 minisuspensions. Data are fold increase, expressed as the ratio of the PLA2 activity of elicitor–to–elicitor-free cell suspensions. Open triangles, antisense Gα line TG11; closed triangles, antisense Gα line TG14; open circles, anti-Gα-scFv line TGA6b; closed circles, anti-Gα-scFv line TGA6e; exes, elicitor-triggered pH shifts. Data are taken in part from Roos et al. (1998).
Figure 7.
Figure 7.
Activity of PLA2 in Single Cells of Elicited and Nonelicited Cultures. PLA2 activities of individual cells that were randomly selected from a wild type or an antisense Gα cell suspension (strain TG11) were measured by confocal microscopy assay (see Methods). Data are sorted by magnitude; each bar refers to one cell. Positions with y = 0 represent cells with nondetectable enzyme activity. The experiment was repeated twice (once in the same and once in another culture batch) and yielded a similar relationship between elicited and nonstimulated cells.
Figure 8.
Figure 8.
Time Course of Vacuolar and Cytoplasmic pH in Wild-Type, Antisense Gα, and Anti-Gα-scFv Cells. pH traces are shown of cells in a flow chamber during perfusion with 75% phosphate-free culture liquid. The pH traces were obtained by confocal pH mapping (ratio imaging with the probe carboxy-seminaphthorhodafluor-4F [SNARF-4F]). In the time period indicated by the arrows, 1 μg/mL of yeast elicitor was present in the perfusion medium. Each trace represents the pH of a cytoplasmic/nuclear area (top curves) or the corresponding central vacuole (bottom curves, same symbols). TG11 and TG14, antisense Gα cell lines; TGA6b and TGA6e, cell lines expressing anti-Gα-scFv antibodies. Each experiment was repeated twice with the indicated cell strain and yielded similar pH traces.
Figure 9.
Figure 9.
Efflux of Vacuolar Protons Triggered by LPC in Situ. Each trace represents the pH of an individual vacuole (pHvac), measured in situ by classic fluorescence microscopy (ratio imaging with 5-carboxyfluorescein according to Viehweger et al., 2002). The perfusion medium contained 1 mM Mg ATP; during the period indicated by arrows, 1 μM LPC (16:0) was also present. Cells with vacuoles of differing initial pH were included in this figure to demonstrate that the efflux triggered by LPC does not depend on the vacuolar pH at the time LPC is added, but rather on the pH gradient across the tonoplast. The vacuolar pH of intact cells ranges from 4.3 to 6.5. TG11 and TG14, antisense Gα cell lines; TGA6b and TGA6e, cell lines expressing anti-Gα-scFv antibodies.
Figure 10.
Figure 10.
Alkaloid Responses Triggered by Different Elicitor Concentrations. The increase in alkaloid content of a cell suspension during 24 h after a 30-min contact with elicitor is compiled for the wild type (7-d culture), the antisense Gα cell lines TG11 (closed triangles) and TG14 (open triangles) (10-d cultures), and the anti-Gα-scFv cell lines TGA6b (open circles) and TGA6e (closed circles) (5-d cultures). Experiments were done at the culture age that usually allowed the highest alkaloid response of either cell line. A typical experiment is shown that was repeated three times with different culture batches (four times with TG11) and yielded essentially similar ratios of response to low and high elicitor concentrations. To address the variability of alkaloid response between different culture batches, data are normalized to the average alkaloid response of wild-type cells evoked by 1 μg/mL of elicitor that was estimated from >20 experiments and set to 100%.
Figure 11.
Figure 11.
Proton Fluxes in Antisense Gα Cells Provoked by Extracellular HEPES Buffer. Confocal pH maps are presented as scanned by confocal ratio imaging with SNARF-4F. Cells were fixed in a microscopic flow chamber that was perfused with the following media: 75% phosphate-free culture liquid ([A]; this pH distribution remained fairly constant up to 1 h); 2 and 30 min, respectively, after replacement with 60 mM K-HEPES, pH 7.4, in 50% phosphate-free culture liquid ([B] and [C]); 10 min after a further replacement with 75% phosphate-free culture liquid (D).
Figure 12.
Figure 12.
Intracellular Proton Fluxes and Subsequent Alkaloid Production Caused by External Buffers. The effect of buffer treatment on vacuolar and cytoplasmic pH was assayed by confocal pH mapping as exemplified in Figure 11. The resulting pH traces are shown alongside percentage of alkaloid production elicited by the same buffer treatment in batch cultures. For pH traces, cell suspensions in a 140-μL cell chamber were perfused with 75% phosphate-free culture liquid, pH 6.5. For the time periods indicated by arrows, it was replaced by 50% phosphate-free nutrient solution containing 60 mM HEPES buffer ([A] to [D]) or 60 mM methylamine (E) of the specified pH. Cells in (C) and (D) were treated wit the same buffer, pH 7.4, over different time periods. Confocal pH maps were obtained at 2-min intervals. pH traces representing two cytosolic areas (top curves) and the corresponding vacuoles (bottom curves) are shown for each experiment. Data from typical experiments were selected; repeated pH mapping with cells of different batches yielded similar pH traces. The bar graphs show alkaloid production per 24 h of 10-mL cell suspensions (4 mg dry weight/mL) that had received the same buffer treatment as specified with the pH traces (exchange of media occurred by no-suction filtration on a nylon mesh). Alkaloid content was assayed 24 h after buffer treatment. Data were normalized to the average alkaloid response of wild-type cells evoked by 1 μg/mL of elicitor that was set to 100% as explained in Figure 10. Typical experiments are compiled. Repetitions with cells of the same and different batches (three times each) yielded alkaloid responses (at an external pH [pHext] of 7.4) between 40 and 60% (TG11) and 65 and 110% (wild type).

Similar articles

Cited by

References

    1. Aharon, G.S., Gelli, A., Snedden, W.A., and Blumwald, E. (1998). Activation of a plant plasma membrane Ca2+ channel by TG α1, a heterotrimeric G protein alpha-subunit homologue. FEBS Lett. 424 17–21. - PubMed
    1. Apone, F., Alyeshmerni, N., Wiens, K., Chalmers, D., Chrispeels, M.J., and Colucci, G. (2003). The G-protein-coupled receptor GCR1 regulates DNA synthesis through activation of phosphatidylinositol-specific phospholipase C. Plant Physiol. 133 571–579. - PMC - PubMed
    1. Armero, J., and Tena, M. (2001). Possible role of plasma membrane H+-ATPase in the elicitation of phytoalexin and related isoflavone root secretion in chickpea (Cicer arietinum L.) seedlings. Plant Sci. 161 791–798.
    1. Artsaenko, O., Peisker, M., zur Nieden, U., Fiedler, U., Weiler, E.W., Müntz, K., and Conrad, U. (1995). Expression of a single chain Fv antibody against abscisic acid creates a wilty phenotype in transgenic tobacco. Plant J. 8 745–750. - PubMed
    1. Artsaenko, O., Philipps, J., Fiedler, U., and Peisker, M., and Conrad, U. (1999). Intracellular immunomodulation in plants: A new tool for the investigation of phytohormones. In Recombinant Antibodies: Applications in Plant Science and Plant Pathology, K. Harper and A. Ziegler, eds (London: Taylor & Francis), pp. 145–156.

Publication types

MeSH terms

LinkOut - more resources