. 2006 May;24(5):531-6.
doi: 10.1038/nbt1195.

In silico pharmacogenetics of warfarin metabolism

Affiliations

In silico pharmacogenetics of warfarin metabolism

Yingying Guo et al. Nat Biotechnol. 2006 May.

Abstract

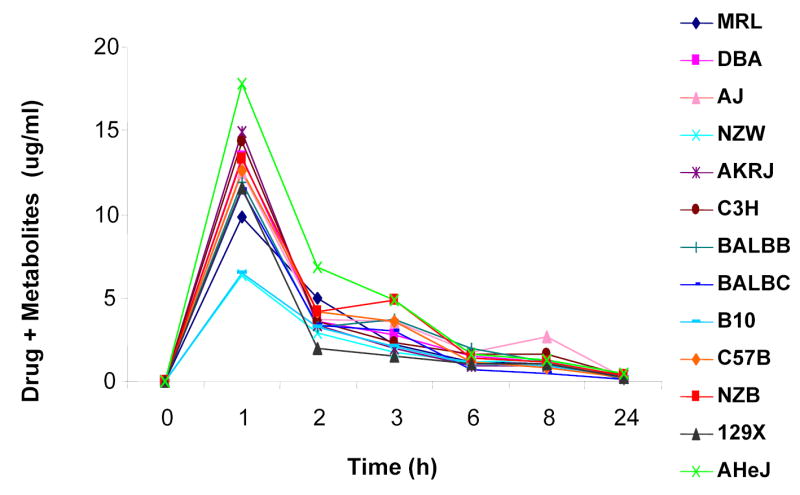
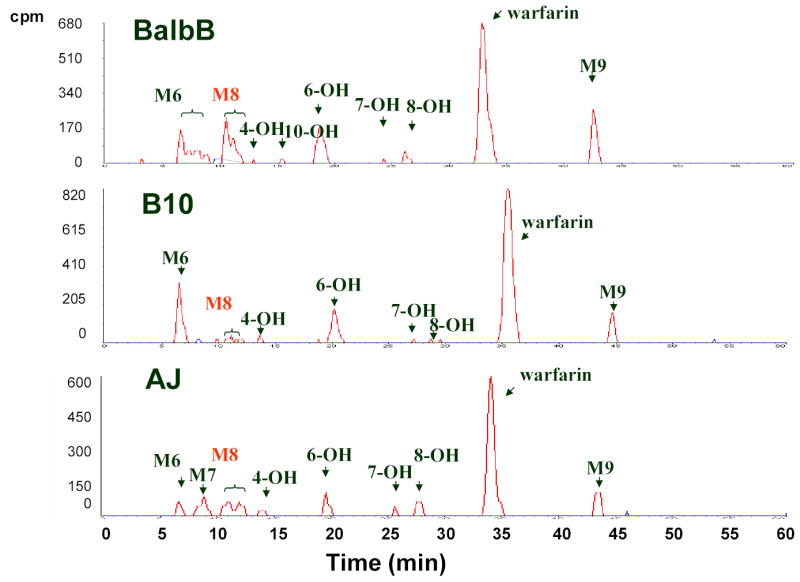
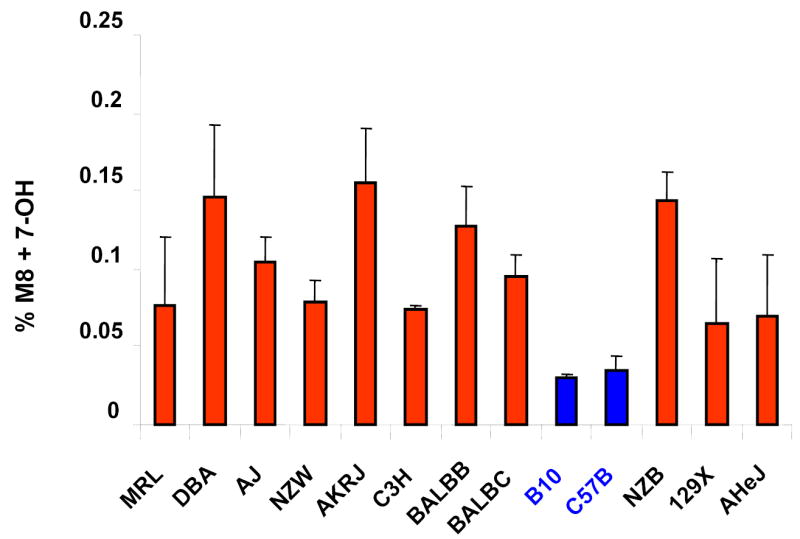
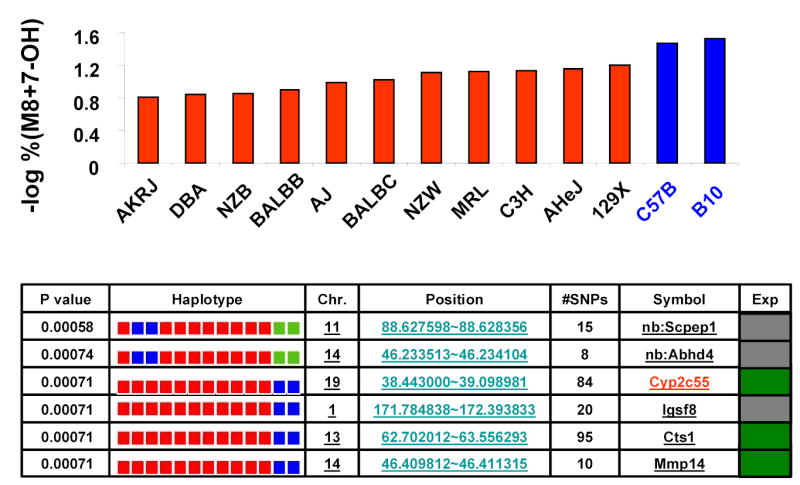
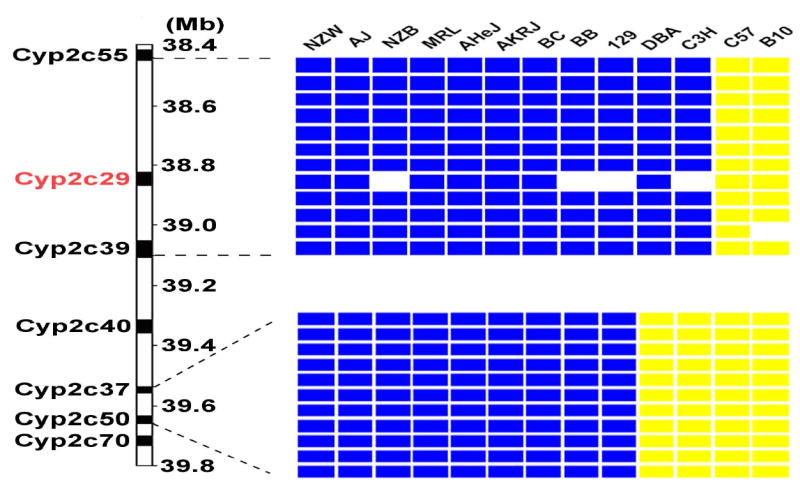
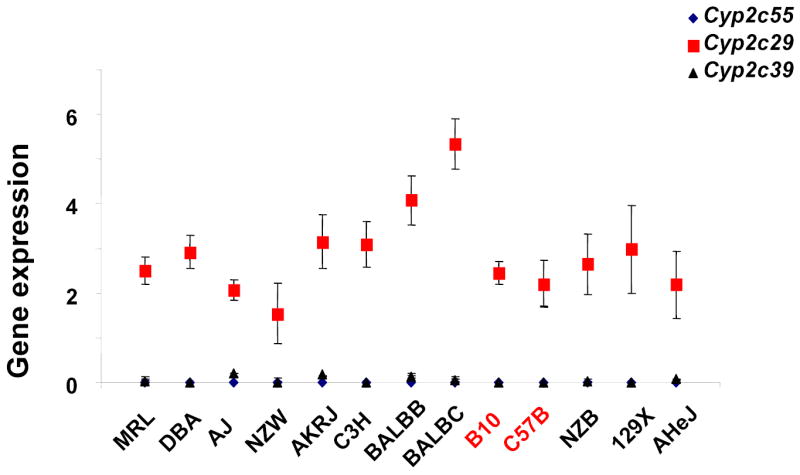
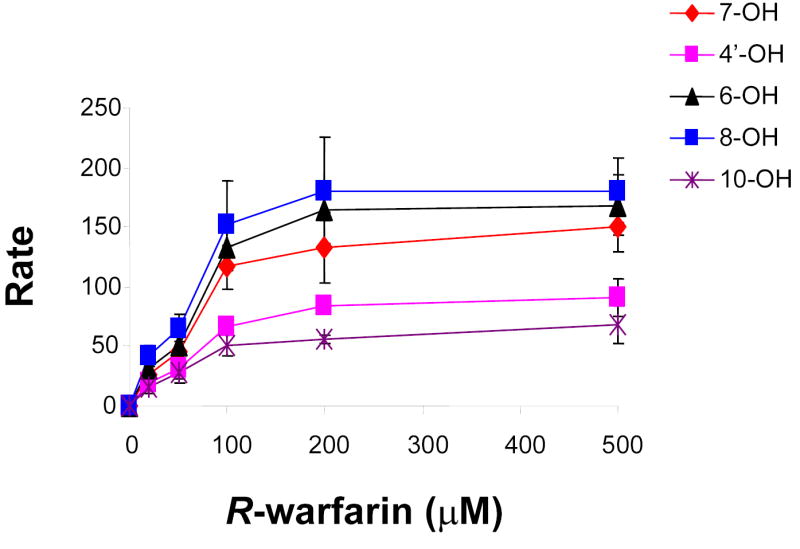
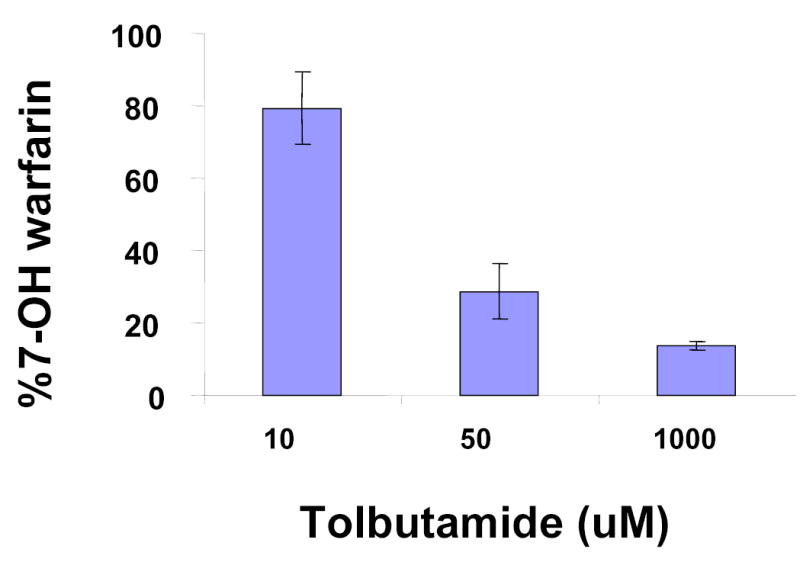
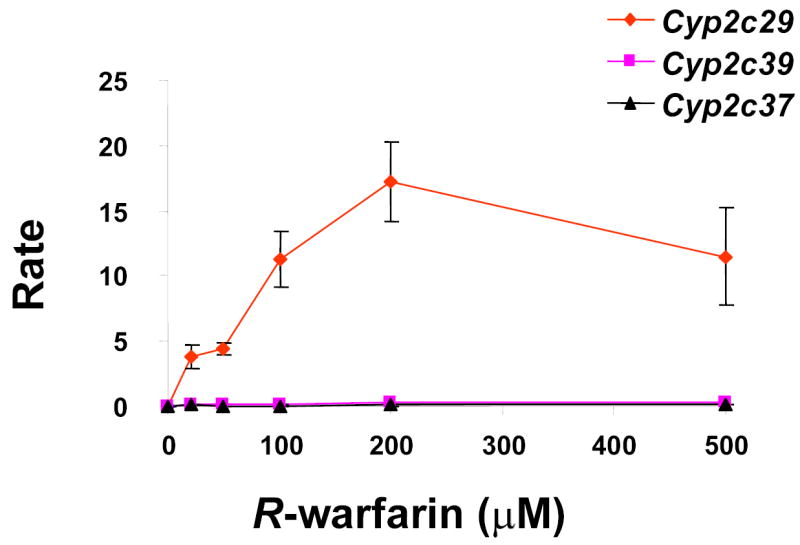
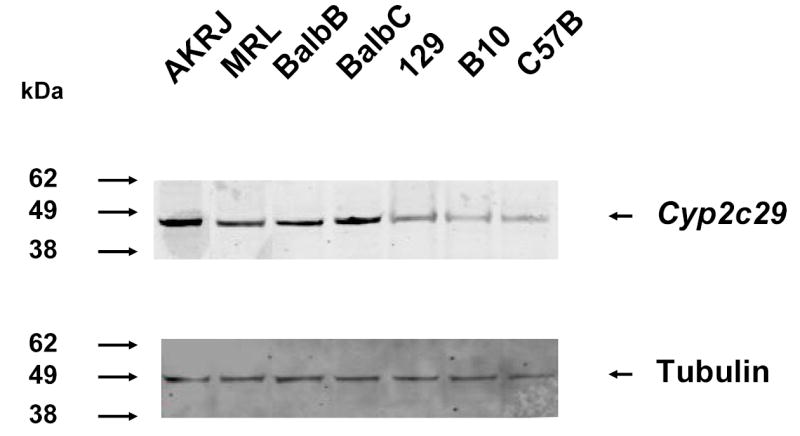
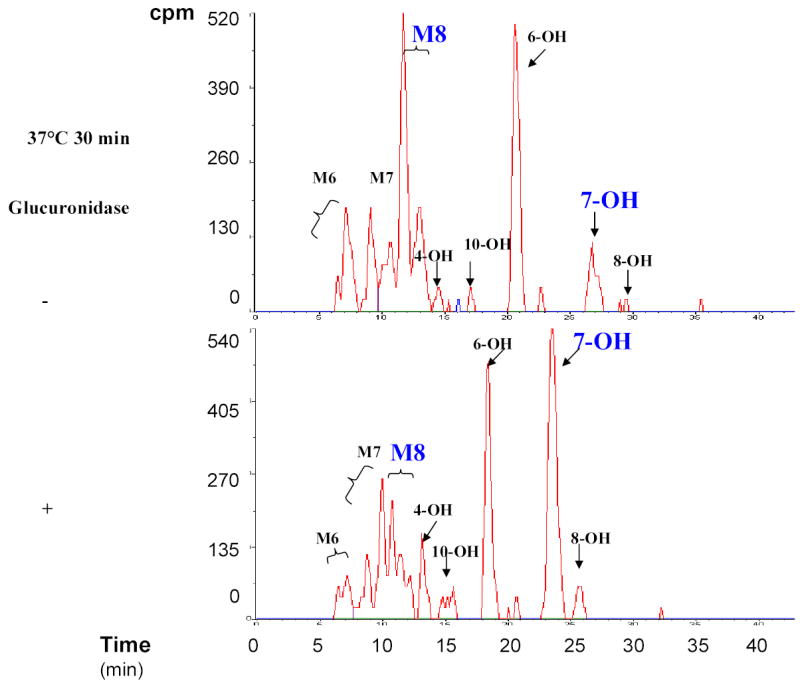
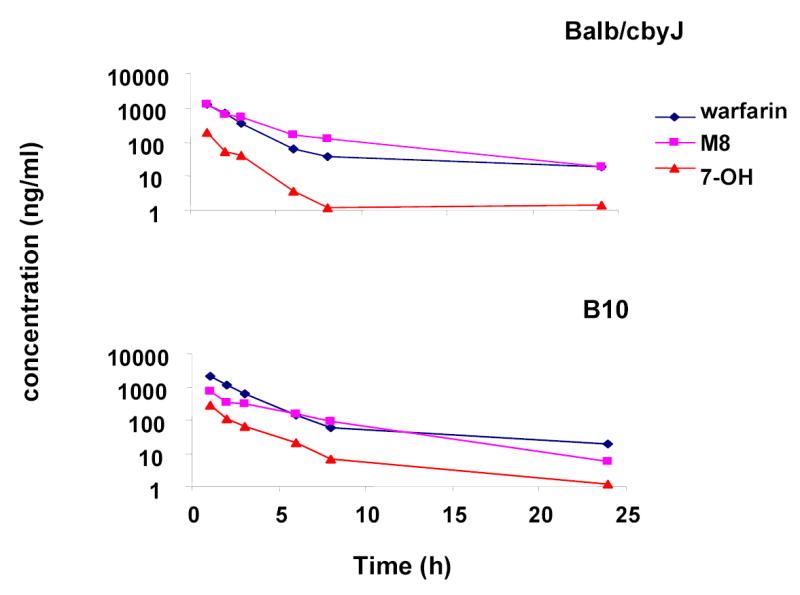
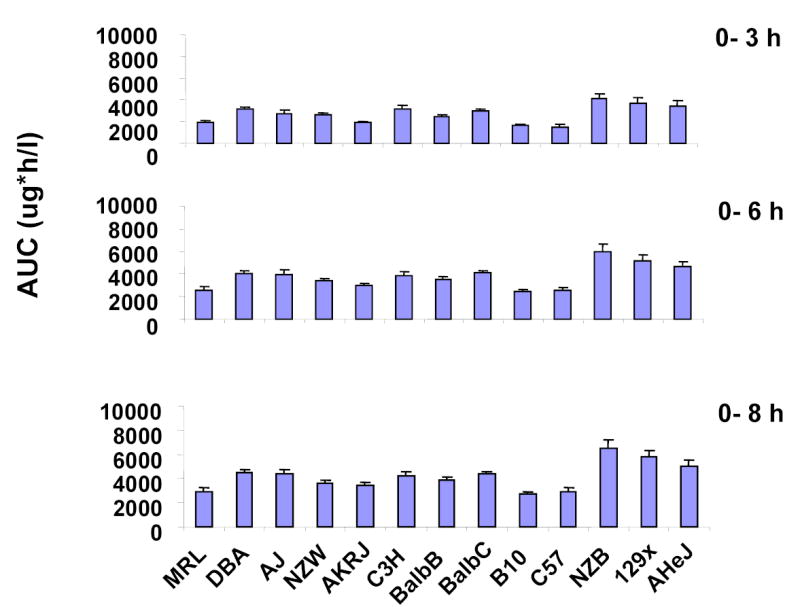
Pharmacogenetic approaches can be instrumental for predicting individual differences in response to a therapeutic intervention. Here we used a recently developed murine haplotype-based computational method to identify a genetic factor regulating the metabolism of warfarin, a commonly prescribed anticoagulant with a narrow therapeutic index and a large variation in individual dosing. After quantification of warfarin and nine of its metabolites in plasma from 13 inbred mouse strains, we correlated strain-specific differences in 7-hydroxywarfarin accumulation with genetic variation within a chromosomal region encoding cytochrome P450 2C (Cyp2c) enzymes. This computational prediction was experimentally confirmed by showing that the rate-limiting step in biotransformation of warfarin to its 7-hydroxylated metabolite was inhibited by tolbutamide, a Cyp2c isoform-specific substrate, and that this transformation was mediated by expressed recombinant Cyp2c29. We show that genetic variants responsible for interindividual pharmacokinetic differences in drug metabolism can be identified by computational genetic analysis in mice.


Figures

Figure 1
Figure 1
R-warfarin metabolism in males of 13 inbred mouse strains. The mean concentration of parent drug and all metabolites in pooled plasma samples, as determined by liquid scintillation counting, is plotted as a function of time after administration of one intraperitoneal (IP) dose of 10 mg/kg of C-R-warfarin to each of 13 inbred mouse strains. Each data point represents the average of two independent measurements performed on a pooled plasma sample prepared three independently treated mice. The similar profile was observed in plasma samples obtained from a second set males of 13 inbred mouse strains that were independently administered the same dose of drug (data not shown).
Figure 2
Figure 2
Analysis of R-warfarin metabolites. Pooled plasma samples obtained 1, 2, 3, 6, and 8 h after a single IP dose of 10 mg/kg C-R-warfarin to males of 13 inbred mouse strains were analyzed by reversed-phase HPLC-radiometric methods. Each distinct peak on the chromatograms represents one of 9 different metabolites identified. The plasma metabolites identified in the Balb/cbyJ, B10.D2J and A/J strains are shown.
Figure 3
Figure 3
Haplotype-based genetic analysis of warfarin metabolites. Panel (A) shows the combined amount of 7-hydroxywarfarin (7-OH) and its glucuronidated metabolite (M8) as a % of the total amount of drug and metabolites, which is indicated as the % M8 + 7-OH for each inbred strain. The data obtained from two independently performed dosing studies is expressed as average + standard deviation. (B) The log-transformation of the measured % M8 + 7-OH for each of 13 inbred strains is shown in the top panel. A representative set of haplotype blocks having the highest correlation with this data set are shown in the lower panel. For each predicted block, the chromosomal location, number of SNPs within a block, its gene symbol and an indicator of gene expression in liver are shown. The haplotype for each strain is represented by a colored block, and is presented in the same order as the phenotypic data in the top panel. The calculated p-value measures the probability that strain groupings within an individual block would have the same degree of association with the phenotypic data by random chance. In the gene expression column, a green square indicates the gene is expressed in liver tissue, while a gray square indicates that it is unknown. The complete list of haplotype blocks is shown in supplemental table V.
Figure 3
Figure 3
Haplotype-based genetic analysis of warfarin metabolites. Panel (A) shows the combined amount of 7-hydroxywarfarin (7-OH) and its glucuronidated metabolite (M8) as a % of the total amount of drug and metabolites, which is indicated as the % M8 + 7-OH for each inbred strain. The data obtained from two independently performed dosing studies is expressed as average + standard deviation. (B) The log-transformation of the measured % M8 + 7-OH for each of 13 inbred strains is shown in the top panel. A representative set of haplotype blocks having the highest correlation with this data set are shown in the lower panel. For each predicted block, the chromosomal location, number of SNPs within a block, its gene symbol and an indicator of gene expression in liver are shown. The haplotype for each strain is represented by a colored block, and is presented in the same order as the phenotypic data in the top panel. The calculated p-value measures the probability that strain groupings within an individual block would have the same degree of association with the phenotypic data by random chance. In the gene expression column, a green square indicates the gene is expressed in liver tissue, while a gray square indicates that it is unknown. The complete list of haplotype blocks is shown in supplemental table V.
Figure 4
Figure 4
(A) The location of Cyp2c genes on chromosome 19 and the haplotypes for 13 inbred mouse strains in this region are shown. On the left, the chromosomal position of each Cyp2c gene is indicated as base pairs downstream of the centromere. The right panel shows two distinct haplotype blocks that extend from Cyp2c55 to Cyp2c39 (38,443,000 to 39,098,981), and from Cyp2c37 to Cyp2c50 (39,536,137 to 39,658,804). The genomic position of each haplotypic block was determined using mouse genome NCBI build 33. Within a block, each column represents one inbred mouse strain, and each box represents the corresponding allele for the indicated mouse strain. A blue box indicates that the strain has the most common (or major) allele, a yellow the minor allele, and an empty box indicates that the allele is unknown. (B) The level of Cyp2c gene (Cyp2c55, 29 and 39) expression in liver among males of 13 inbred mouse strains measured by RT-PCR. Each data point is the average ± standard error of 3 measurements performed on 3 liver samples, and was normalized relative to the expression level of actin.
Figure 4
Figure 4
(A) The location of Cyp2c genes on chromosome 19 and the haplotypes for 13 inbred mouse strains in this region are shown. On the left, the chromosomal position of each Cyp2c gene is indicated as base pairs downstream of the centromere. The right panel shows two distinct haplotype blocks that extend from Cyp2c55 to Cyp2c39 (38,443,000 to 39,098,981), and from Cyp2c37 to Cyp2c50 (39,536,137 to 39,658,804). The genomic position of each haplotypic block was determined using mouse genome NCBI build 33. Within a block, each column represents one inbred mouse strain, and each box represents the corresponding allele for the indicated mouse strain. A blue box indicates that the strain has the most common (or major) allele, a yellow the minor allele, and an empty box indicates that the allele is unknown. (B) The level of Cyp2c gene (Cyp2c55, 29 and 39) expression in liver among males of 13 inbred mouse strains measured by RT-PCR. Each data point is the average ± standard error of 3 measurements performed on 3 liver samples, and was normalized relative to the expression level of actin.
Figure 5
Figure 5
(A) In vitro biotransformation of R-warfarin in mouse liver microsomes. The rate (pmol/min/nmol CYP) of formation of the indicated metabolites was measured after incubation with the indicated concentrations of R-warfarin in CD-1 mouse liver microsomal preparations. Each data point represents the average ± standard deviation of 3 individual measurements. (B) The effect of a Cyp2c isoform-specific inhibitor (tolbutamide) on the rate of formation of 7-hydroxywarfarin from R-warfarin (150 μM) in mouse liver microsomes was measured. Each data point represents the average ± standard error of 3 individual measurements. (C) In vitro biotransformation of R-warfarin by expressed recombinant murine Cyp2c29, Cyp2c39 and Cyp2c37 cDNAs. The rate (pmol/min/nmol CYP) of formation of 7-hydroxywarfarin was measured after incubation with the indicated concentrations of R-warfarin. cDNAs were generated from a strain with a high rate (Balb/cbyJ) and a low rate (B.10.D2-H2/oSnJ) of generation of 7- hydroxywarfarin and M8 metabolites. Cyp2c29 biotransformed R-warfarin to 7-hydroxywarfarin, while Cyp2c39 and Cyp2c37 lacked this activity. Each data point represents the average ± standard deviation of 4 individual measurements.
Figure 5
Figure 5
(A) In vitro biotransformation of R-warfarin in mouse liver microsomes. The rate (pmol/min/nmol CYP) of formation of the indicated metabolites was measured after incubation with the indicated concentrations of R-warfarin in CD-1 mouse liver microsomal preparations. Each data point represents the average ± standard deviation of 3 individual measurements. (B) The effect of a Cyp2c isoform-specific inhibitor (tolbutamide) on the rate of formation of 7-hydroxywarfarin from R-warfarin (150 μM) in mouse liver microsomes was measured. Each data point represents the average ± standard error of 3 individual measurements. (C) In vitro biotransformation of R-warfarin by expressed recombinant murine Cyp2c29, Cyp2c39 and Cyp2c37 cDNAs. The rate (pmol/min/nmol CYP) of formation of 7-hydroxywarfarin was measured after incubation with the indicated concentrations of R-warfarin. cDNAs were generated from a strain with a high rate (Balb/cbyJ) and a low rate (B.10.D2-H2/oSnJ) of generation of 7- hydroxywarfarin and M8 metabolites. Cyp2c29 biotransformed R-warfarin to 7-hydroxywarfarin, while Cyp2c39 and Cyp2c37 lacked this activity. Each data point represents the average ± standard deviation of 4 individual measurements.
Figure 6
Figure 6
Immunoblot analysis of Cyp2c29 protein in liver extracts prepared from 7 inbred strains. Liver microsomal extracts prepared from 5 strains (AKRJ: AKR/J; MRL: MRL/MpJ; BalbB: Balb/cybJ; BalbC: Balb/cJ; 129x: 129x1/svJ) with a high rate, and 2 strains with a low rate (B10: B10.D2; C57B: C57B/6J) of 7-hydroxywarfarin generation. Immunobloting was performed on 25 μg of protein per lane using a polyclonal anti-murine Cyp2c29 IgY antibody (upper panel). The blot was then stripped and re-probed with an anti-tubulin antibody as a control for the amount of protein in each lane (lower panel). The relative mobility of molecular weight markers is shown on the left.
Supplemental Figure 1
β–glucuronidase hydrolysis of M8 (putative warfarin conjugates). Urine samples obtained from drug-treated MRL/MpJ mice were hydrolyzed with β–glucuronidase, and the HPLC-radiometric chromatograms of samples before and after enzymatic hydrolysis are shown. Comparison of these chromatograms indicate that there is a decrease in M8 and a proportional increase in 7-hydroxywarfarin after enzymatic digestion. The indicated metabolites were identified by retention time, sensitivity to β–glucuronidase, and ultraviolet spectra.
Supplemental Figure 2
A logarithmic plot comparing the plasma concentrations of R-warfarin, 7-hydroxywarfarin and M8 in strains with a high rate (Balb/cbyJ) and a low rate (B.10.D2-H2/oSnJ) of generating 7-hydroxywarfarin metabolites. A single IP 10 mg/kg dose of C-R-warfarin was administered to males of 13 inbred mouse strains. The concentrations of R-warfarin and the two metabolites in plasma samples were quantitated by LC/MS/MS. Each data point represents the average of 3–5 different mice analyzed at each time point.
Supplemental Figure 3
The Area Under Concentration-time Curve (AUC) for 7-hydroxywarfarin metabolites (7-OH + M8) within 8 hr after a 10 mg/kg IP dose of C-R-warfarin was administered to males of 13 inbred mouse strains. The concentrations of the indicated metabolite in plasma were measured by LC/MS/MS analysis. Each data point is the average ± the standard deviation of 3 samples.

References

    1. Evans WE, Relling MV. Pharmacogenomics: translating functional genomics into rational therapeutics. Science. 1999;286:487–91. - PubMed
    1. Wang, J., Peltz, G. Haplotype-Based Computational Genetic Analysis in Mice. In Computational Genetics and Genomics: New Tools for Understanding Disease (ed. Peltz, G.) 51–70 (Humana Press Inc, Totowa, NJ, 2005).
    1. Wang J, Liao G, Usuka J, Peltz G. Computational genetics: from mouse to human? Trends Genet. 2005;21:526–32. - PubMed
    1. Liao G, et al. In silico genetics: identification of a functional element regulating H2-Ealpha gene expression. Science. 2004;306:690–5. - PubMed
    1. Wang, J., et al.,. Haplotypic structure of the mouse genome. In Computational Genetics and Genomics: New Tools for Disease Biology (ed. Peltz, G.) 71–83 (Humana Press Inc, Totowa, NJ, 2005).

Publication types