. 2006 May;2(5):e70.
doi: 10.1371/journal.pgen.0020070. Epub 2006 May 5.

High-resolution recombination patterns in a region of human chromosome 21 measured by sperm typing

Affiliations

High-resolution recombination patterns in a region of human chromosome 21 measured by sperm typing

Irene Tiemann-Boege et al. PLoS Genet. 2006 May.

Abstract

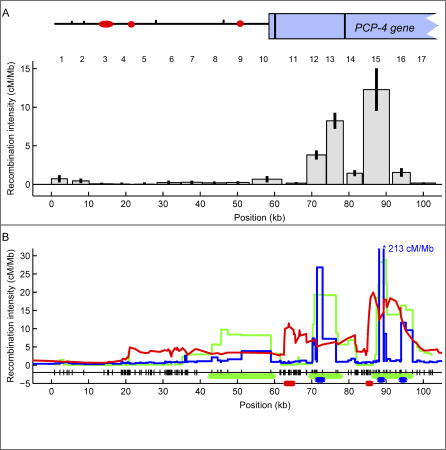
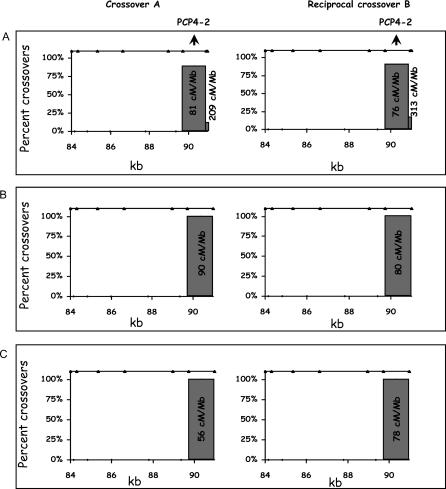
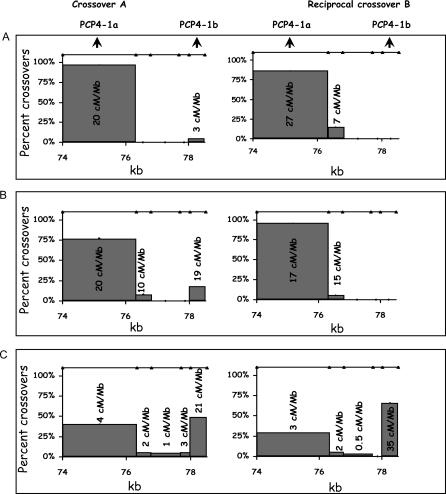
For decades, classical crossover studies and linkage disequilibrium (LD) analysis of genomic regions suggested that human meiotic crossovers may not be randomly distributed along chromosomes but are focused instead in "hot spots." Recent sperm typing studies provided data at very high resolution and accuracy that defined the physical limits of a number of hot spots. The data were also used to test whether patterns of LD can predict hot spot locations. These sperm typing studies focused on several small regions of the genome already known or suspected of containing a hot spot based on the presence of LD breakdown or previous experimental evidence of hot spot activity. Comparable data on target regions not specifically chosen using these two criteria is lacking but is needed to make an unbiased test of whether LD data alone can accurately predict active hot spots. We used sperm typing to estimate recombination in 17 almost contiguous ~5 kb intervals spanning 103 kb of human Chromosome 21. We found two intervals that contained new hot spots. The comparison of our data with recombination rates predicted by statistical analyses of LD showed that, overall, the two datasets corresponded well, except for one predicted hot spot that showed little crossing over. This study doubles the experimental data on recombination in men at the highest resolution and accuracy and supports the emerging genome-wide picture that recombination is localized in small regions separated by cold areas. Detailed study of one of the new hot spots revealed a sperm donor with a decrease in recombination intensity at the canonical recombination site but an increase in crossover activity nearby. This unique finding suggests that the position and intensity of hot spots may evolve by means of a concerted mechanism that maintains the overall recombination intensity in the region.


Conflict of interest statement

Competing interests. The authors have declared that no competing interests exist.

Figures

Figure 1
Figure 1. Illustration of the Experimental Approach
(A) Shown here are all four possible meiotic products. One of the two recombinants (R1) is selectively amplified in two rounds of allele-specific PCR by using forward and the reverse primers that both form a perfect match with the chosen crossover type, in this case R1 (shown here in a red box). One mismatch is formed with the two non-recombinant (NR1 and NR2) meiotic products and two mismatches with the other crossover type (R2). In a second PCR round, new allele-specific primers anneal to an internal pair of SNPs and the specific recombinant is enriched further. (B) In order to analyze a million meioses, ~300 aliquots containing ~3,000 sperm genomes were analyzed. Given that recombination is a rare event, only a few aliquots contain a single recombinant molecule (aliquot with a single recombinant shown in red). The second PCR was performed in a real-time PCR machine to monitor the preferential amplification of the chosen recombinant over the other meiotic products. (C) The amplification curve obtained for each sperm aliquot was compared to the amplification obtained for positive controls (containing non-recombinants with, on average, one added recombinant which, based on the Poisson distribution, will render only 65% of the aliquots positive) and negative controls (containing only non-recombinants). Two distinct clusters are formed of positive and negative amplification curves. The number of sperm aliquots with positive amplification curves was considered the number of recombinants. Similarly, sperm aliquots with negative amplification curves were considered not to contain a recombinant. Additional details can be found in Materials and Methods.
Figure 2
Figure 2. Recombination across a 103-kb Region in Chromosome 21
(A) The histogram shows the recombination intensities measured in 17 intervals (the interval number is shown on top of each bar) of the 103-kb region of Chromosome 21. For intervals 13 and 15 we plotted the average of both reciprocal crossovers. Shown on top of the histogram is the genetic structure of the region (circles/ovals represent long interspersed nuclear elements and short interspersed nuclear elements, tick marks represent long terminal repeats, and the rectangle represents the partial PCP4 gene; exons are shown as black vertical lines). The recombination intensity in cM/Mb is corrected for false positives. Gaps represent areas where no recombination data could be collected. The 95% confidence interval for each measurement is shown as an error bar. (B) Recombination intensities calculated with three different LD estimators: LD-Hat in green, Hotspotter in blue, and ABC in red. Note that the predicted peak at ~90 kb (interval 15) for Hotspotter is 213 cM/Mb and thus off scale. All three estimators used the Perlegen SNP database [35]. SNPs are shown as marks next to the x-axis. The thick green, blue, or red horizontal lines above the x-axis mark the region with statistical support for a hot spot in LDHat, Hotspotter, or ABC, respectively. See Materials and Methods and Table 1 for details and Protocol S6 for a list of estimated recombination intensities for all three algorithms in our region.
Figure 3
Figure 3. Crossover Distribution in Interval 15 for Three Different Individuals
The breakpoint of the crossover was determined by genotyping the SNPs (shown as triangles on top of each graph) using PCR product obtained from individual crossovers. Percentages represent the fraction of crossovers counted between two adjacent informative SNPs and are plotted against the position of the crossover for both type A and the reciprocal type B recombinants. The numbers associated with each bar represent the recombination intensities in cM/Mb (see details in Protocol S2). (A) Crossover distribution in interval 15 for an individual based on 36 and 24 recombinants recovered from 66,000 and 44,000 meioses, respectively. Note that this individual has one more informative SNP 50 bp before the end of the interval compared to the other two donors. Only a small fraction of the crossovers occur within these last 50 bps, but the estimated recombination intensity ranges between ~200 to 300 cM/Mb because this region is so small. (B) Crossover distribution in a second donor based on 37 and 12 recombinants recovered from 66,000 and 24,000 meioses, respectively. (C) Crossover distribution for a third donor based on 23 and 43 recombinants recovered from 66,000 and 88,000 meioses, respectively. For a detailed comparison of the crossover distribution with the three LD based estimates, see Protocol S5.
Figure 4
Figure 4. Crossover Distribution in Interval 13 for Three Different Individuals
For additional details see the legend to Figure 3. (A) Crossover distribution for a donor based on 30 and 21 reciprocal recombinants recovered from 126,000 and 89,300 meioses, respectively. Numbers associated with each bar are the recombination intensities in cM/Mb. (B) Crossover distribution for a second donor based on 13 and 20 recombinants recovered from 42,000 and 60,400 meioses, respectively. (C) Crossover distribution for a third individual based on 25 and 49 recombinants recovered from 223,200 and 358,000 meioses, respectively. See Protocol S5 for a comparison of averaged recombination intensities of the 3 donors with the LD estimators.

References

    1. Kauppi L, Jeffreys AJ, Keeney S. Where the crossovers are: Recombination distributions in mammals. Nat Rev Genet. 2004;5:413–424. - PubMed
    1. Petes TD. Meiotic recombination hot spots and cold spots. Nat Rev Genet. 2001;2:360–369. - PubMed
    1. Carrington M, Cullen M. Justified chauvinism: Advances in defining meiotic recombination through sperm typing. Trends Genet. 2004;20:196–205. - PubMed
    1. Arnheim N, Calabrese P, Nordborg M. Hot and cold spots of recombination in the human genome: The reason we should find them and how this can be achieved. Am J Hum Genet. 2003;73:5–16. - PMC - PubMed
    1. Clark AG. Hot spots unglued. Nat Genet. 2005;37:563–564. - PubMed

Publication types