Comparative Study
. 2006 Jul 1;497(1):13-31.
doi: 10.1002/cne.20968.

Neonatal deafness results in degraded topographic specificity of auditory nerve projections to the cochlear nucleus in cats

Affiliations
Comparative Study

Neonatal deafness results in degraded topographic specificity of auditory nerve projections to the cochlear nucleus in cats

Patricia A Leake et al. J Comp Neurol. .

Abstract

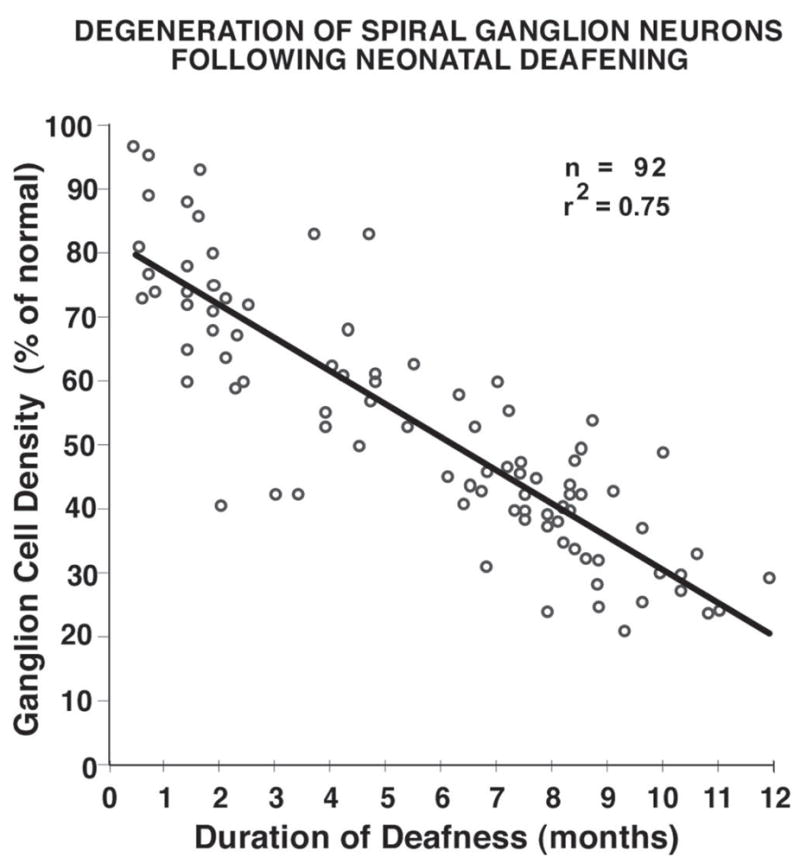
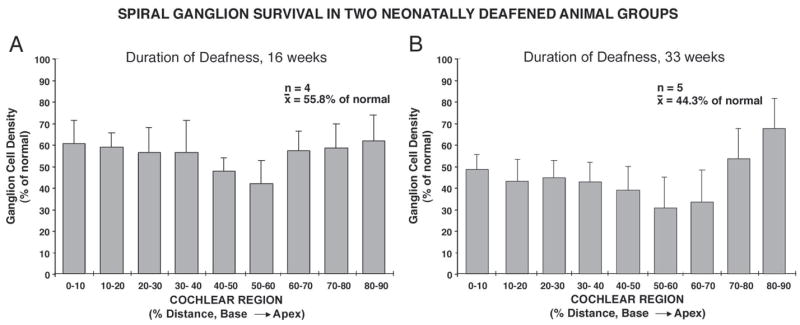
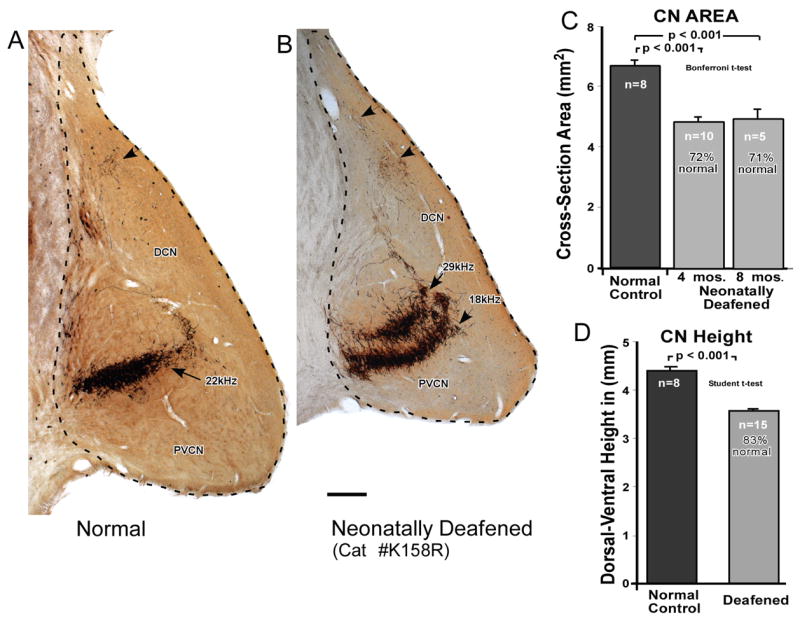
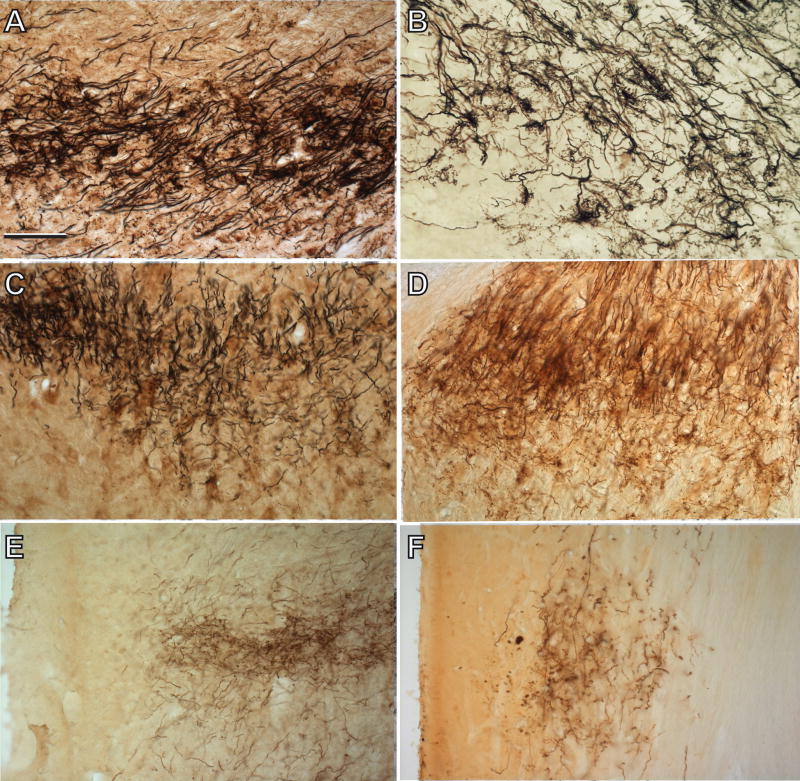
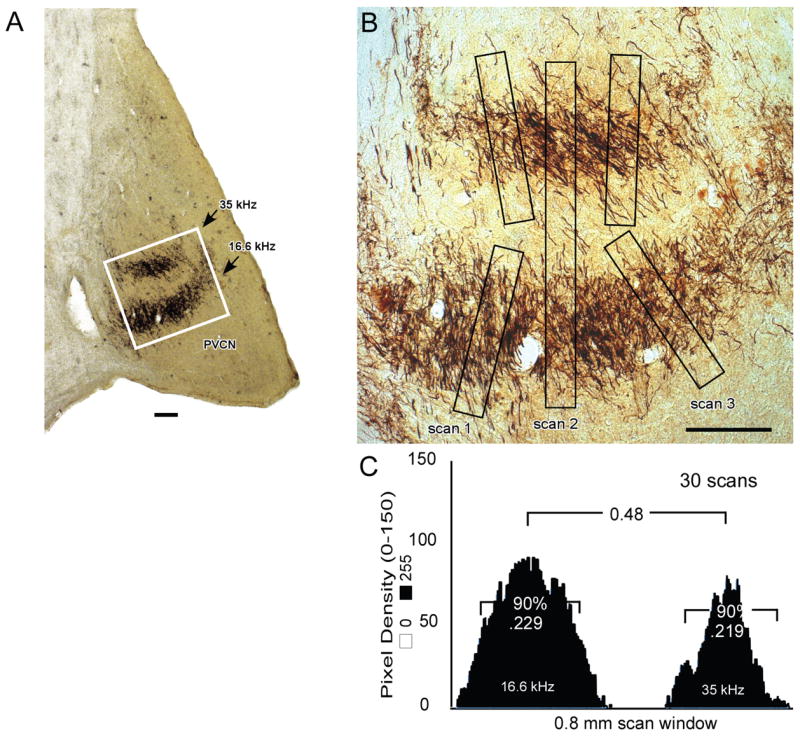
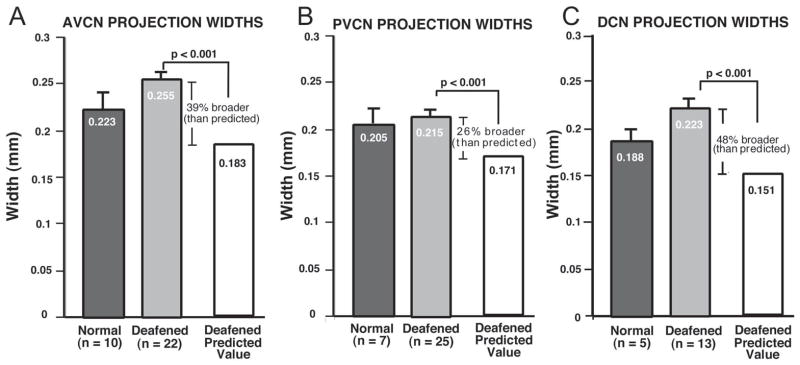
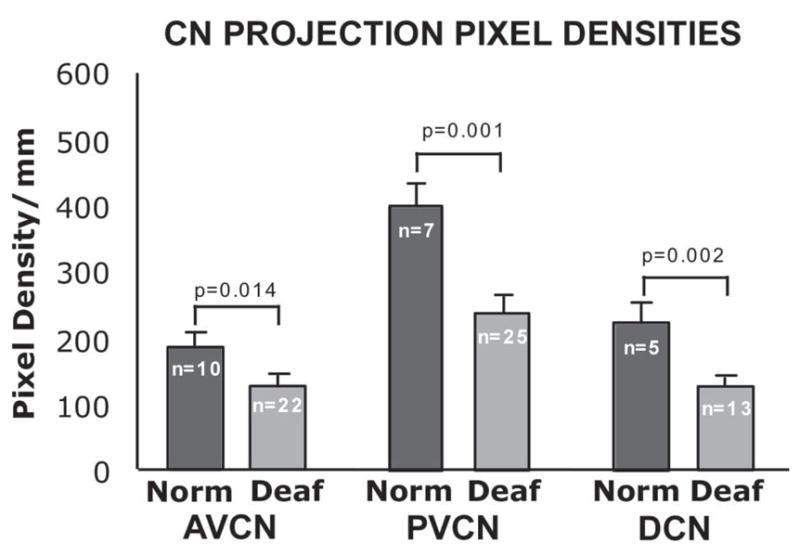
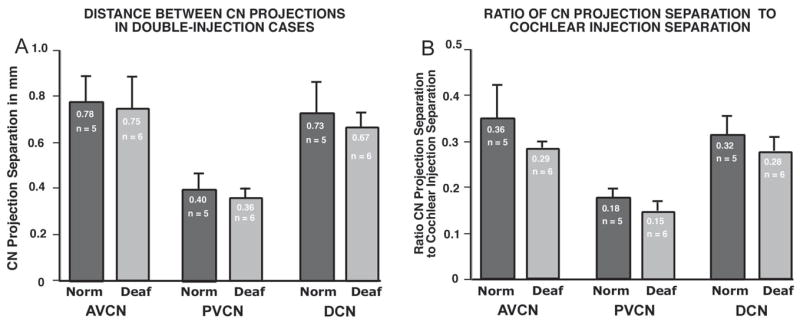
We previously examined the early postnatal maturation of the primary afferent auditory nerve projections from the cat cochlear spiral ganglion (SG) to the cochlear nucleus (CN). In normal kittens these projections exhibit clear cochleotopic organization before birth, but quantitative data showed that their topographic specificity is less precise in perinatal kittens than in adults. Normalized for CN size, projections to the anteroventral (AVCN), posteroventral (PVCN), and dorsal (DCN) subdivisions are all significantly broader in neonates than in adults. By 6-7 postnatal days, projections are proportionate to those of adults, suggesting that significant refinement occurs during the early postnatal period. The present study examined SG projections to the CN in adult cats deafened as neonates by ototoxic drug administration. The fundamental organization of the SG-to-CN projections into frequency band laminae is clearly evident despite severe auditory deprivation from birth. However, when normalized for the smaller CN size in deafened animals, projections are disproportionately broader than in controls; AVCN, PVCN, and DCN projections are 39, 26, and 48% broader, respectively, than predicted if they were precisely proportionate to projections in normal hearing animals. These findings suggest that normal auditory experience and neural activity are essential for the early postnatal development (or subsequent maintenance) of the topographic precision of SG-to-CN projections. After early deafness, the basic cochleotopic organization of the CN is established and maintained into adulthood, but the CN is severely reduced in size and the topographic specificity of primary afferent projections that underlies frequency resolution in the normal central auditory system is significantly degraded.


Figures

Figure 1
Figure 1
Survival of spiral ganglion (SG) neurons is shown as a function of duration of deafness for cats deafened immediately after birth by administration of daily injections of the ototoxic drug, neomycin sulfate. The data are presented as mean SG cell density (averaged throughout the cochlea) and expressed as percent of normal. SG survival is strongly correlated with duration of deafness, although there is considerable individual variability for a given duration of deafness.
Figure 2
Figure 2
Spiral ganglion cell densities in the two groups of neonatally deafened cats included in this study are shown as percent of normal for cochlear sectors from base to apex. The first group of 5 neonatally deafened subjects was studied at 3–5 months of age (A). SG data are shown for 4 subjects in this group (because SG data were not available for one of the subjects), and the mean SG density was 55.8% of normal. The second group of 5 neonatally deafened subjects received a unilateral cochlear implant and underwent several months of electrical stimulation of the cochlea, but data from only the contralateral, non-implanted, non-stimulated cochlea and cochlear nucleus are included in the current study. The graph in B shows that SG density in this second group was 44.3% of normal. Error bars indicate standard error of the mean.
Figure 3
Figure 3
Images of radial sections through the organ of Corti illustrate the two NB injection sites in cat deafened as a neonate and examined at more than 9 months of age (cat #158). A. This section was taken at about 6 mm from the base (?18 kHz in the normal cochlea) in the region of the apical injection site. Note that the organ of Corti has completely degenerated, collapsing into little more than a squamous cell layer (arrow). Most of the radial nerve fibers that normally innervate the hair cells have degenerated, and very few can be seen within the osseous spiral lamina due to the duration of deafness in this subject. Note, however, that many of the central axons passing into the auditory nerve at the left of the image appear to be intact. Damage to the bone overlying Rosenthal’s canal (arrowheads) and a hemorrhage within the canal resulting from the NB injection are evident. B. Section through Rosenthal’s canal at about 3.0 mm from the base (? 29 kHz) showing the maximum development of the basal injection site in the same cochlea as in A. The arrow indicates the defect in the osseous spiral lamina through which the glass micropipette was inserted and the injection was made. A small hemorrhage is evident. A few spiral ganglion cells are still recognizable at the top of the ganglion, but most have degenerated. Scale bar = 100 μm. C. Injection site size was determined in serial sections evaluated for evidence of damage to Rosenthal’s canal, labeled and damaged spiral ganglion cell somata. Injections in these experiments labeled spiral ganglion neurons innervating cochlear sectors that averaged 412 μm in normal controls and 407 μm in the neonatally deafened animals. Error bars represent standard error of the mean.
Figure 4
Figure 4
A. The overall size of the CN was estimated by measuring the cross-sectional area of the CN in the single largest section taken just posterior to the entrance of the auditory nerve, and tracing the perimeter, as illustrated here in normal adult (A) and neonatally deafened (B) subjects. Scale bar = 0.4 mm. C. The mean CN area was then calculated for the normal adult control group (6.83 mm2) and for the two deafened groups. The two deafened groups had CN cross-sectional areas that were virtually identical to each other (4.84 mm2 for the neonatally deafened group studied at 4 months of age and 4.94 mm2 for the neonatally deafened group studied at about 8 months of age), but the deafened CN were markedly smaller than normal, measuring only about 72% that of normal controls. This difference was highly statistically significant (Student’s t-test, unpaired). D. The dorsal-to-ventral height of the CN was measured to provide a single-dimensional scaling factor that was used to normalize the thickness of SG projections for the smaller CN size in deafened subjects. The CN height was significantly reduced in the deafened group. Error bars indicate standard error of the mean.
Figure 5
Figure 5
A,B. NB labeled auditory nerve fibers in the AVCN projection lamina in a normal adult cat (A) and in a neonatally deafened cat (B) examined at about 8 months of age (K169). Arrows indicate auditory nerve calyceal endings, which appear to be relatively normal light microscopy, although not as dense as normal. C,D. NB labeled auditory nerve fibers in the PVCN of a normal adult (C) and in another neonatally deafened subject (D) examined at more than 9 months of age (K158) and for which the cochlear injection sites are illustrated in Figure 3. The image illustrates the complexity and density of the neuropil in PVCN and the fine string endings, which are seen passing ventrally from the main projection lamina along its caudal extent. E,F. Labeled auditory nerve fibers in the DCN projection lamina of a normal adult cat (E) and a deafened subject (F), illustrating the fine caliber of labeled auditory nerve fibers and terminals in this region. Scale bar in A = 100 μm and indicates magnification for all micrographs.
Figure 6
Figure 6
A,B. CN projection thickness was estimated by determining the mean pixel density in windows of 0.5 mm (25 pixels) by 0.04 mm (200 pixels) with the scan window positioned orthogonal to the projection lamina (e.g., scans 1 and 3 in B). The scans were always executed beginning at the low frequency side of each lamina. In each image, 3 scans were made orthogonal to each projection lamina. The section illustrated is taken from a deafened animal (K169) that was studied at about 8 months of age. Outlined area in A is equal to 1 mm2 and is shown at higher magnification in B. C. For each projection, scans from all sections were averaged. Threshold level was set by subtracting background density until the first negative value occurred in the window. The average plot was normalized, and projection thickness was calculated as the distance containing 90% of the total pixel density. This value was 0.219 mm for the 35 kHz (upper) projection and 0.229 mm for the 16.6 kHz (lower) projection to the PVCN illustrated here. The separation between 2 laminae was determined in a larger scan window of 0.5 mm by 0.8 mm as illustrated by scan 2 in B and measuring the distance between the two maxima in the averaged pixel density plot as shown in C. Scale bars in A and B = 200 μm.
Figure 7
Figure 7
A. The data for mean thickness of projection laminae in the AVCN are shown, as measured in sections from normal adult controls (black bar) and for all neonatally deafened animals (gray bar). The mean projection thickness in deafened subjects (255 μm) actually was slightly greater than normal (223 μm). Moreover, when the normalized value predicted for the smaller deafened CN was calculated (i.e., if laminae in the deafened CN were precisely proportionate to those in the normal CN), the predicted value was 183 μm. Thus, the AVCN projections in the deafened animals were 39% broader than predicted if they were proportionate to the projections in normal control subjects. B. Data are shown here for the PVCN projections in the same groups. The PVCN projection laminae measured in normal controls had a mean thickness of 205 μm, and the PVCN projection thickness measured in deafened animals was very similar, with an average value of 215 μm. When normalized for the smaller size of the CN in the deafened group, however, the predicted PVCN projection thickness was 171 μm. Thus, the measured PVCN projections thickness in deafened animals was proportionately 26% broader than in normal controls. C. The DCN projection laminae measured in normal controls averaged 188 μm. The absolute mean values for projections in deafened subjects were slightly larger than normal, with an average of 0.223 mm. When normalized for CN size, the expected DCN projection thickness for the deafened group was 0.151 mm. Thus, DCN projections in the deafened animals were 48% broader than projections in controls, when scaled relative to CN size. Note that the absolute values for both the PVCN and DCN projection thickness in deafened subjects were slightly larger than the corresponding values in normal controls, but these differences were not significant. The error bars indicate standard error of the mean.
Figure 8
Figure 8
Average pixel density values for all scans are compared for normal controls and deafened groups in each of the CN subdivisions. In all three subdivisions of the nucleus, AVCN and PVCN and DCN, pixel densities are significantly reduced in the deafened subjects as compared to normal controls. Error bars represent standard error of the mean.
Figure 9
Figure 9
A. Mean separation distance between CN projection laminae is shown for cases in which two successful injections were made in a single cochlea, and projections to all 3 CN subdivisions were sufficiently intense to be measured. Data shown compare absolute values for separation distances in AVCN, PVCN and DCN in control and neonatally deafened groups. The separation in AVCN and DCN projections was about double that between the corresponding PVCN projections. B. The data from A are normalized for the separation between injection sites by dividing the absolute CN projection separation values by the separation distances for the corresponding cochlear injection sites. When the intersubject variability is taken into account in this manner, the proportionate values were always smaller in the deafened CN. Since the CN laminae in deafened animals are equal in thickness to projections in the normal group, this finding that projections are closer together in the deafened group supports the suggestion that the CN projections from adjacent cochlear sectors must be more overlapping in the deafened group.

Similar articles

Cited by

References

    1. Bonham BH, Cheung SW, Benoit G, Schreiner CE. Spatial organization of frequency response areas and rate/level functions in the developing AI. J Neurophysiol. 2004;91:841–854. - PubMed
    1. Brawer JR, Morest DK, Kane EI. The neuronal architecture of the cochlear nucleus of the cat. J Comp Neurol. 1974;155:251–300. - PubMed
    1. Brugge JF, Reale RA, Wilson GF. Sensitivity of auditory cortical neurons of kittens to monaural and binaural high frequency sound. Hearing Res. 1988;34:127–140. - PubMed
    1. Cant NB, Morest DK. The structural basis for stimulus coding in the cochlear nucleus of the cat. In: Berlin C, editor. Hearing Science: Recent Advances. San Diego: College-Hill; 1984. pp. 371–421.
    1. Chalupa LM, Snider CJ. Topographic specificity in the retinocollicular projection of the developing ferret: an anterograde tracing study. J Comp Neurol. 1998;392:35–47. - PubMed

Publication types

MeSH terms