

Phenotypic variation and natural selection at catsup, a pleiotropic quantitative trait gene in Drosophila
- PMID: 16682353
- PMCID: PMC10766118
- DOI: 10.1016/j.cub.2006.03.051
Phenotypic variation and natural selection at catsup, a pleiotropic quantitative trait gene in Drosophila
Abstract
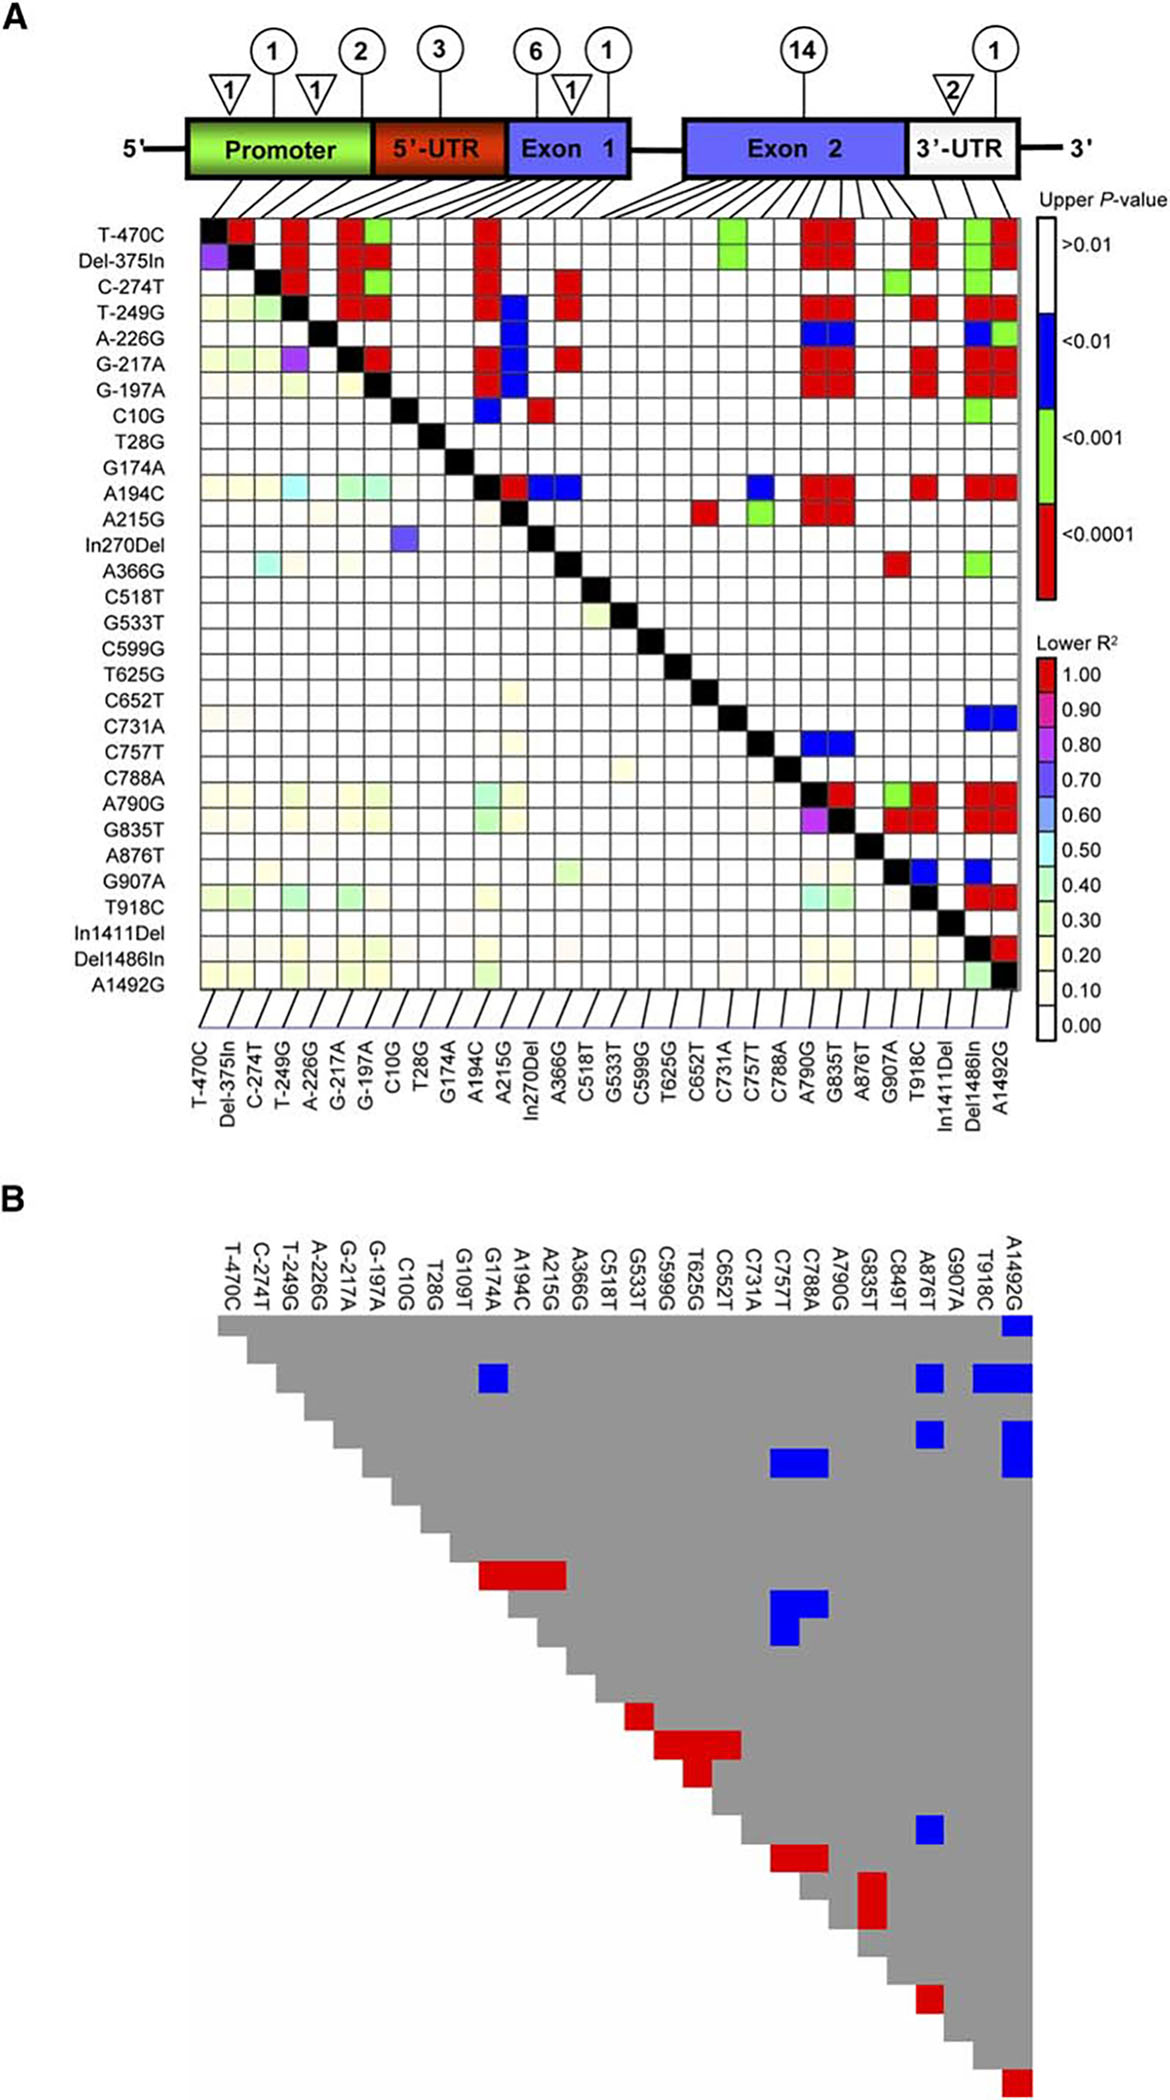
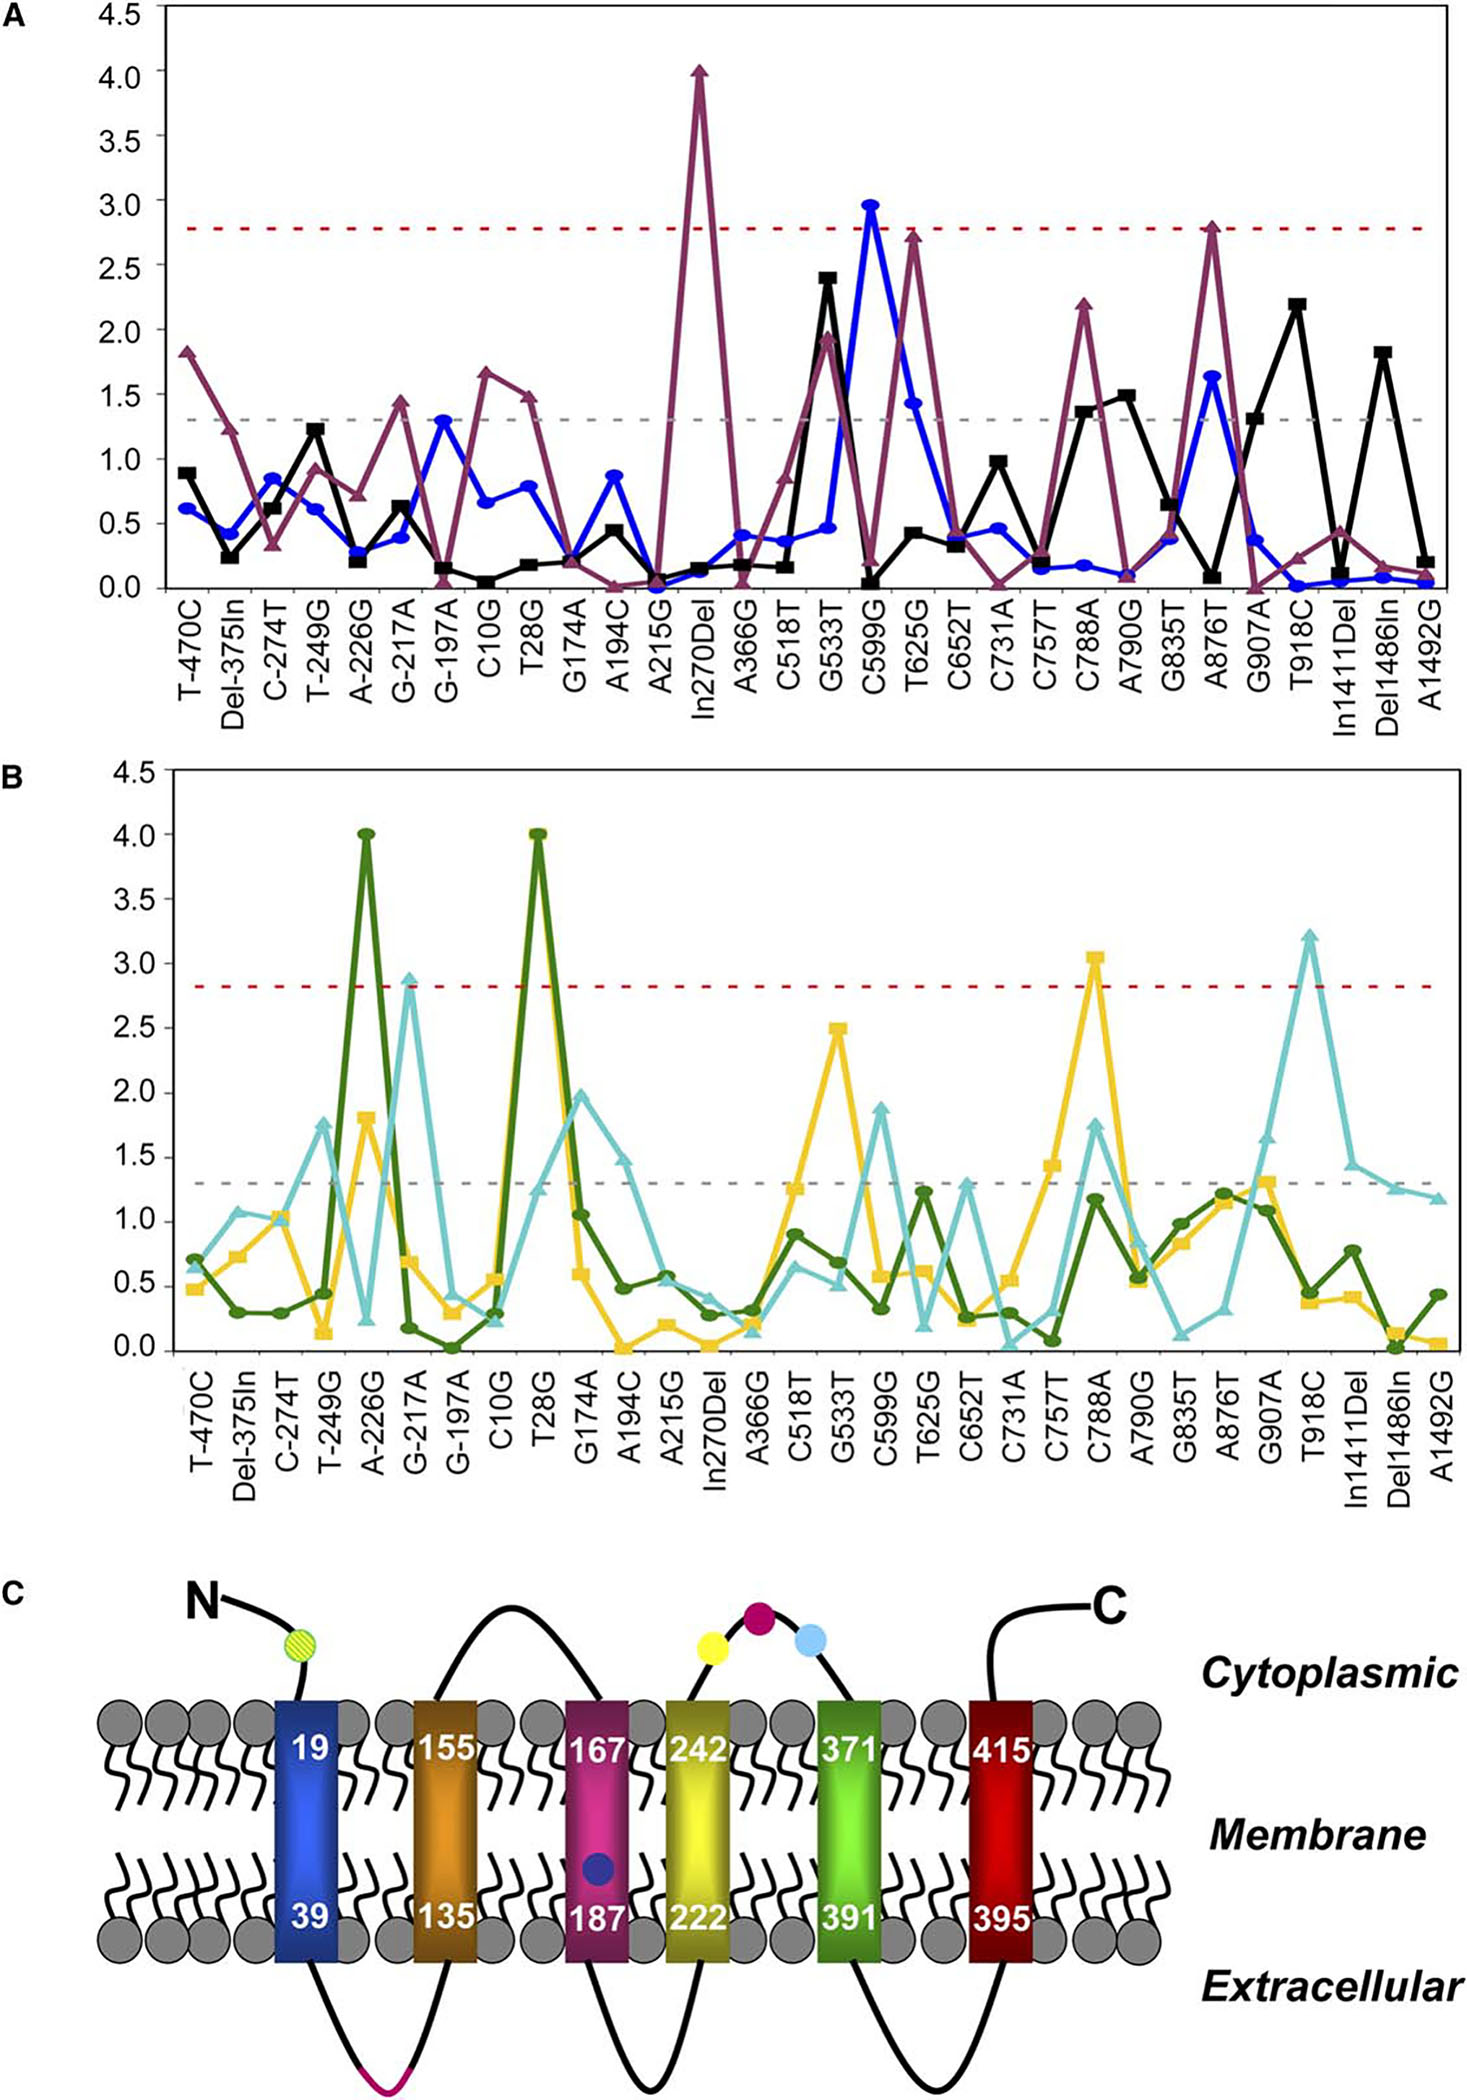
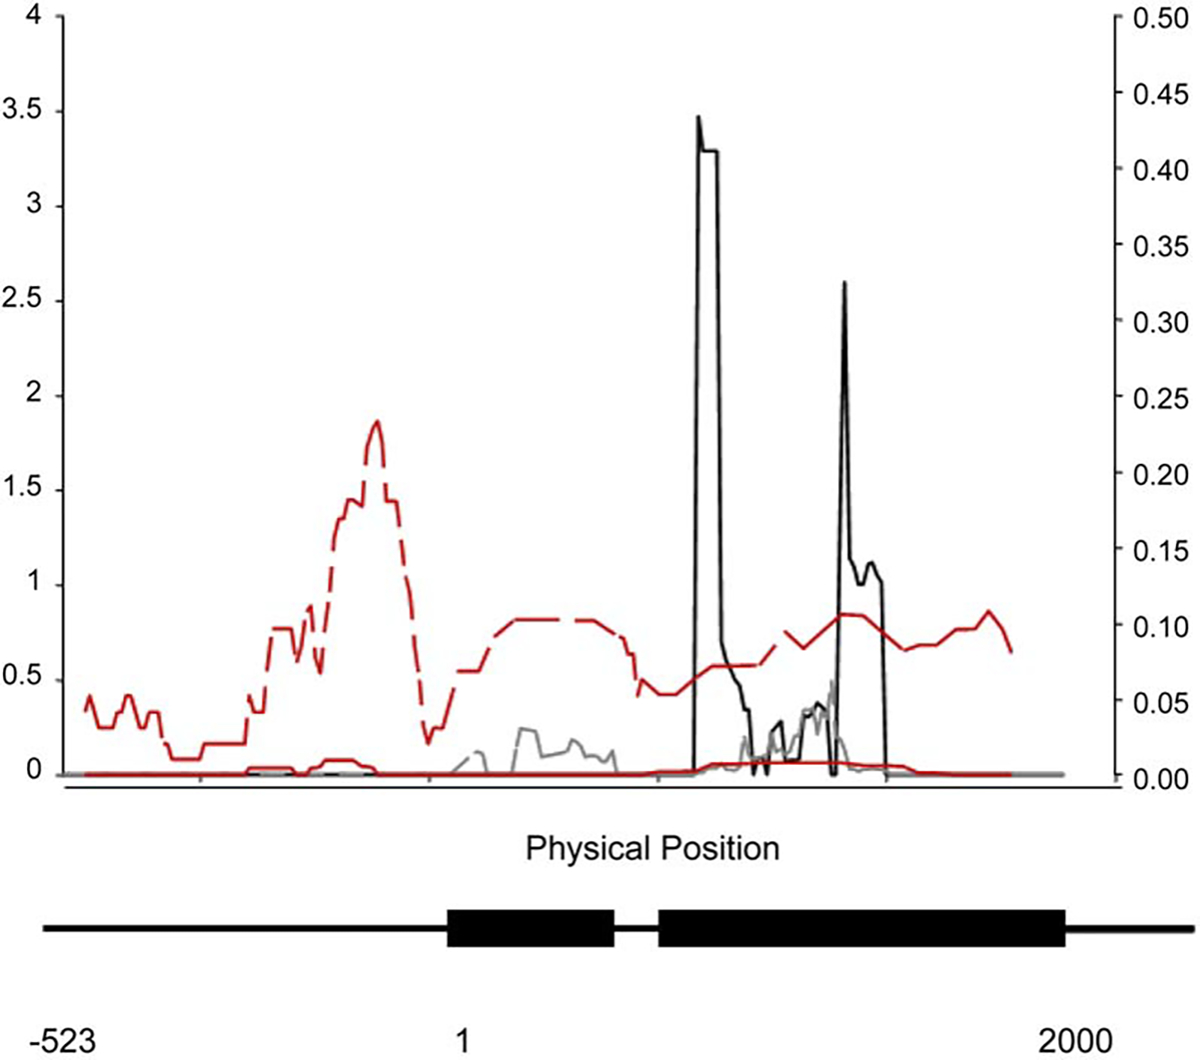
Quantitative traits are shaped by networks of pleiotropic genes . To understand the mechanisms that maintain genetic variation for quantitative traits in natural populations and to predict responses to artificial and natural selection, we must evaluate pleiotropic effects of underlying quantitative trait genes and define functional allelic variation at the level of quantitative trait nucleotides (QTNs). Catecholamines up (Catsup), which encodes a negative regulator of tyrosine hydroxylase , the rate-limiting step in the synthesis of the neurotransmitter dopamine, is a pleiotropic quantitative trait gene in Drosophila melanogaster. We used association mapping to determine whether the same or different QTNs at Catsup are associated with naturally occurring variation in multiple quantitative traits. We sequenced 169 Catsup alleles from a single population and detected 33 polymorphisms with little linkage disequilibrium (LD). Different molecular polymorphisms in Catsup are independently associated with variation in longevity, locomotor behavior, and sensory bristle number. Most of these polymorphisms are potentially functional variants in protein coding regions, have large effects, and are not common. Thus, Catsup is a pleiotropic quantitative trait gene, but individual QTNs do not have pleiotropic effects. Molecular population genetic analyses of Catsup sequences are consistent with balancing selection maintaining multiple functional polymorphisms.
Figures
References
-
- Mackay TFC (2001). The genetic architecture of quantitative traits. Annu. Rev. Genet. 35, 303–339. - PubMed
-
- O’Donnell JM, Wang Z, and Chaudhuri A (2004). Effects of perturbation of catecholamine regulation on resistance of Drosophila melanogaster to environmental stress. In Pterins, Folates, and Related Biogenic Amines, Blau N and Thony B, eds. (Heilbronn: SPS Publications; ), pp. 94–100.
-
- Mackay TFC, Roshina NV, Leips JW, and Pasyukova EG (2005). Complex genetic architecture of Drosophila longevity. In Handbook of the Biology of Aging, Sixth Edition, Masaro EJ and Austad SN, eds. (Burlington: Elsevier Press; ), pp. 181–216.
Publication types
MeSH terms
Substances
Associated data
- Actions
- Actions
- Actions
- Actions
- Actions
- Actions
- Actions
- Actions
- Actions
- Actions
- Actions
- Actions
- Actions
- Actions
- Actions
- Actions
- Actions
- Actions
- Actions
- Actions
- Actions
- Actions
- Actions
- Actions
- Actions
- Actions
- Actions
- Actions
- Actions
- Actions
- Actions
- Actions
- Actions
- Actions
- Actions
- Actions
- Actions
- Actions
- Actions
- Actions
- Actions
- Actions
- Actions
- Actions
- Actions
- Actions
- Actions
- Actions
- Actions
- Actions
- Actions
- Actions
- Actions
- Actions
- Actions
- Actions
- Actions
- Actions
- Actions
- Actions
- Actions
- Actions
- Actions
- Actions
- Actions
- Actions
- Actions
- Actions
- Actions
- Actions
- Actions
- Actions
- Actions
- Actions
- Actions
- Actions
- Actions
- Actions
- Actions
- Actions
- Actions
- Actions
- Actions
- Actions
- Actions
- Actions
- Actions
- Actions
- Actions
- Actions
- Actions
- Actions
- Actions
- Actions
- Actions
- Actions
- Actions
- Actions
- Actions
- Actions
- Actions
- Actions
- Actions
- Actions
- Actions
- Actions
- Actions
- Actions
- Actions
- Actions
- Actions
- Actions
- Actions
- Actions
- Actions
- Actions
- Actions
- Actions
- Actions
- Actions
- Actions
- Actions
- Actions
- Actions
- Actions
- Actions
- Actions
- Actions
- Actions
- Actions
- Actions
- Actions
- Actions
- Actions
- Actions
- Actions
- Actions
- Actions
- Actions
- Actions
- Actions
- Actions
- Actions
- Actions
- Actions
- Actions
- Actions
- Actions
- Actions
- Actions
- Actions
- Actions
- Actions
- Actions
- Actions
- Actions
- Actions
- Actions
- Actions
- Actions
- Actions
- Actions
- Actions
- Actions
- Actions
- Actions
- Actions
- Actions
- Actions
- Actions
- Actions
- Actions
Grants and funding
LinkOut - more resources
Full Text Sources
Other Literature Sources
Molecular Biology Databases
Research Materials
