. 2006 May 16;103(20):7801-6.
doi: 10.1073/pnas.0602646103. Epub 2006 May 8.

Multiorgan engraftment and differentiation of human cord blood CD34+ Lin- cells in goats assessed by gene expression profiling

Affiliations

Multiorgan engraftment and differentiation of human cord blood CD34+ Lin- cells in goats assessed by gene expression profiling

Fanyi Zeng et al. Proc Natl Acad Sci U S A. .

Abstract

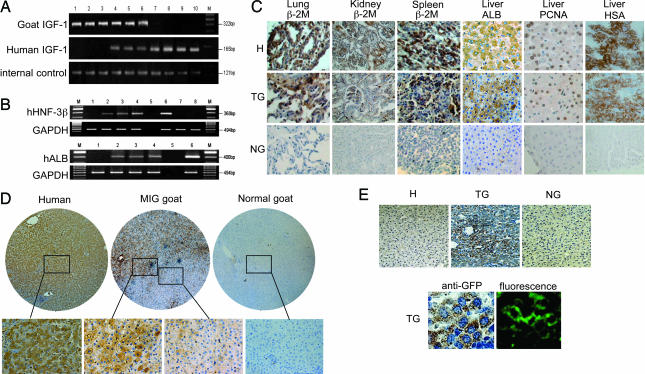
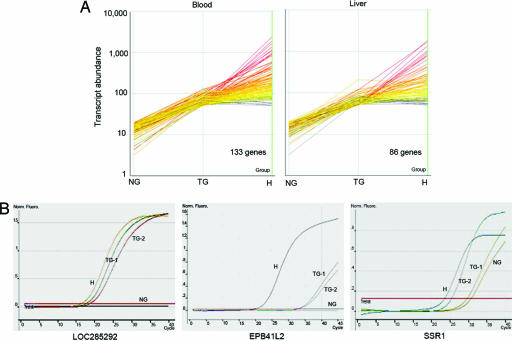
To investigate multitissue engraftment of human primitive hematopoietic cells and their differentiation in goats, human CD34+ Lin- cord blood cells transduced with a GFP vector were transplanted into fetal goats at 45-55 days of gestation. GFP+ cells were detected in hematopoietic and nonhematopoietic organs including blood, bone marrow, spleen, liver, kidney, muscle, lung, and heart of the recipient goats (1.2-36% of all cells examined). We identified human beta2 microglobulin-positive cells in multiple tissues. GFP+ cells sorted from the perfused liver of a transplant goat showed human insulin-like growth factor 1 gene sequences, indicating that the engrafted GFP+ cells were of human origin. A substantial fraction of cells engrafted in goat livers expressed the human hepatocyte-specific antigen, proliferating cell nuclear antigen, albumin, hepatocyte nuclear factor, and GFP. DNA content analysis showed no evidence for cellular fusion. Long-term engraftment of GFP+ cells could be detected in the blood of goats for up to 2 yr. Microarray analysis indicated that human genes from a variety of functional categories were expressed in chimeric livers and blood. The human/goat xenotransplant model provides a unique system to study the kinetics of hematopoietic stem cell engraftment, gene expression, and possible stem cell plasticity under noninjured conditions.


Conflict of interest statement

Conflict of interest statement: No conflicts declared.

Figures

Fig. 1.
Fig. 1.
Detection of human GFP+ cells in various tissues of the MIG goats. (A Upper) Fluorescence emission and hematoxylin/eosin (HE) staining in tissue sections of a representative goat transplanted with MIG-GFP-transduced CD34+Lin CB cells. (Magnification: ×400.) (A Lower) Tissue sections were prepared from a normal (negative control) goat. (Magnification: ×400.) (B) GFP+ human cells were detected by FACS analysis in hematopoietic and nonhematopoietic organs of the recipient goats (MIG-1 and MIG-2). The GFP+ cells comprised a wide range (1.2–36%) of the examined cell populations. (C) FACS analysis of GFP+ cells from the perfused liver of goat MIG-3 2 yr after birth. The histogram shows number of cells vs. GFP fluorescence units.
Fig. 2.
Fig. 2.
Identification of specific human genes in MIG-transplant goats. (A) IGF-1 genes were detected in MIG-transplant goats and sorted GFP+ cells by PCR analysis using primer sets specific for unique human or goat sequences, or a shared sequence (internal control). M, molecular weight DNA marker. Lanes 1–3, amplicons from liver DNA samples from three different normal goats. Lanes 4–6, liver DNA samples from three different MIG goats. Lane 7, the liver DNA sample from sorted GFP+ cells. Lanes 8–10, liver DNA samples from three humans. (B) RT-PCR analysis of human gene transcripts for hepatocyte nuclear factor 3β and serum albumin (hALB) expressed in the transplant liver tissue but not in the control goats. GAPDH is used as internal control. Lane 1, normal goat RNA. Lanes 2–4, RNA from three MIG goats. Lane 5, blank. Lane 6, positive control from human liver. Lanes 7 and 8, RNA from human CB cells. (C) Immunohistochemistry analysis for human β2 microglobulin antigen, hALB, proliferating cell nuclear antigen, and hepatocyte-specific antigen; brown staining shows positive cells in various tissues of transplant goat (TG) and human (H) samples. No positive cells are found in control goats (NG). (Magnification: ×400.) (D) Staining for hALB was performed on sections of human, MIG-transplant goat, and normal goat livers and is shown at ×50 and ×200 magnification. Although the human tissue is uniformly positive and normal goat is entirely negative, the chimeric liver contains regions of high staining density surrounded by nonstaining cells. The margin of one such region is shown with further magnification of adjacent positive and negative areas. (E Upper) Anti-GFP staining (brown) was present in the liver cells (cytoplasm) of MIG-transplant goat (TG) but not in human or normal goat (NG). (Magnification: ×100.) (E Lower) GFP+ cells in the liver of TG with immunohistochemistry staining, and corresponding images with fluorescence emission. (Magnification: ×400.)
Fig. 3.
Fig. 3.
Detection of human DNA in MIG-transplant goat. (A Top) FACS of samples from perfused liver to enrich for the GFP population. The resulting cell pool was reanalyzed by FACS to assess enrichment, producing the cytogram of cell counts vs. fluorescence. (A Middle and Bottom) Individual cells from the sorted pool were observed under light (Middle) and fluorescence (Bottom) microscopy and compared to normal goat liver cells. (B) FACS to measure DNA content discriminated goat and human cells by total chromosome number. DNA content is shown for perfused human liver (a), normal goat liver (b), MIG goat liver (c), and sorted GFP+ cells from perfused MIG goat liver (d). H, human, 2n = 46 chromosomes; G, goat, 2n = 60 chromosomes.
Fig. 4.
Fig. 4.
Gene expression analysis from human cells in transplant goats. (A) Microarray transcript profiles are shown for selected human genes. The panels plot the expression levels of detected human transcripts in normal goats (NG), transplant goats (TG), and human (H) with low or no detection in normal goats and at least 2.5-fold higher expression in transplant goats. (B) Real-time quantitative RT-PCR confirmed expression levels of three candidate genes from the microarray profiles. LOC285292 was assayed from blood samples, and EPB41L2 and SSR1 were assayed from liver samples. GAPDH cDNA is used as an internal control.

References

    1. Elfenbein G. J., Sackstein R. Exp. Hematol. 2004;32:327–339. - PubMed
    1. Hongeng S., Pakakasama S., Chaisiripoomkere W., Chuansumrit A., Sirachainan N., Ungkanont A., Jootar S. Bone Marrow Transplant. 2004;33:377–379. - PubMed
    1. Orofino M. G., Argiolu F., Sanna M. A., Tuveri T., Scalas M. T., Badiali M., Cossu P., Puddu R., Lai M. E., Cao A. Lancet. 2003;362:41–42. - PubMed
    1. McDonough C. H., Jacobsohn D. A., Vogelsang G. B., Noga S. J., Chen A. R. Bone Marrow Transplant. 2003;31:1073–1080. - PMC - PubMed
    1. Buckner C. D., Epstein R. B., Rudolph R. H., Clift R. A., Storb R., Thomas E. D. J. Hematother. Stem Cell Res. 2001;10:201–208. - PubMed

Publication types

MeSH terms

Associated data