. 2006 Apr;2(4):e37.
doi: 10.1371/journal.pcbi.0020037. Epub 2006 Apr 21.

Codon usage domains over bacterial chromosomes

Affiliations

Codon usage domains over bacterial chromosomes

Marc Bailly-Bechet et al. PLoS Comput Biol. 2006 Apr.

Abstract

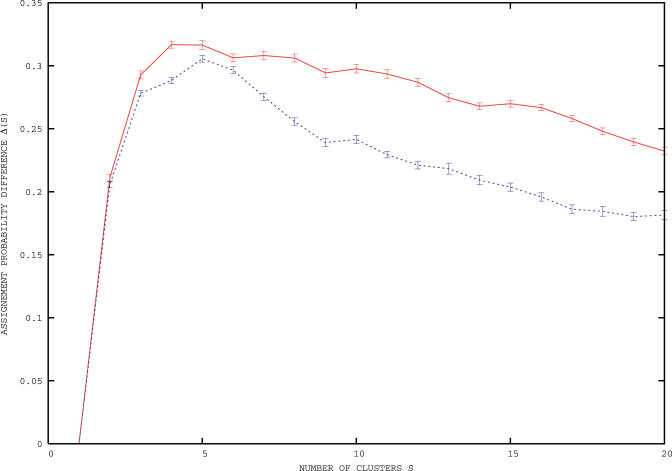
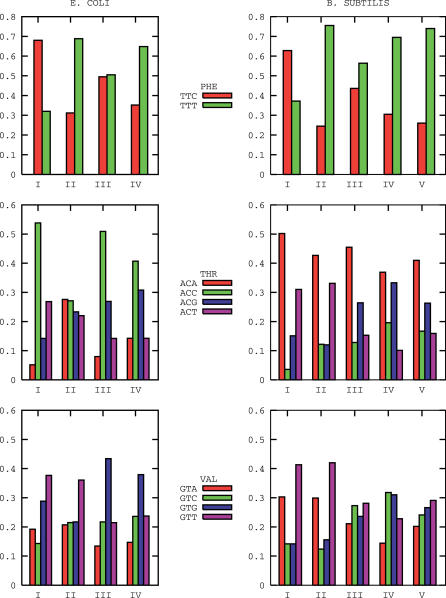
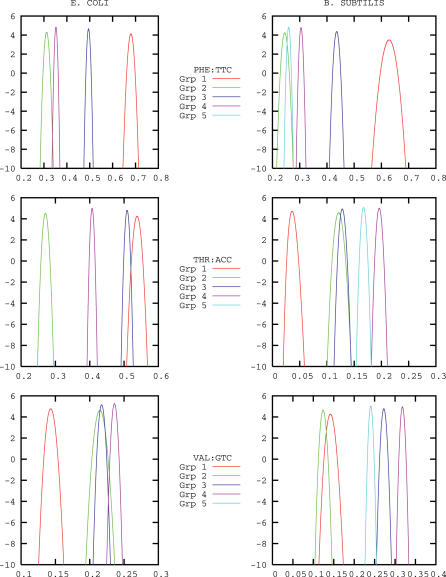
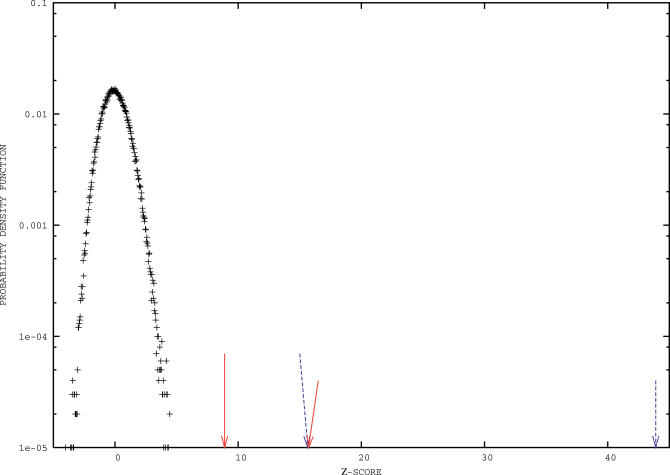
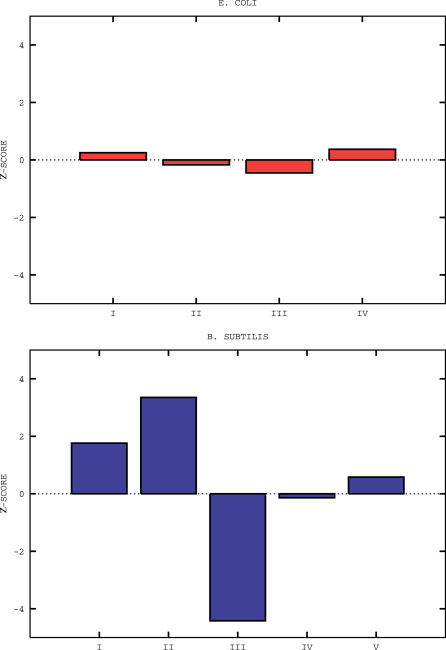
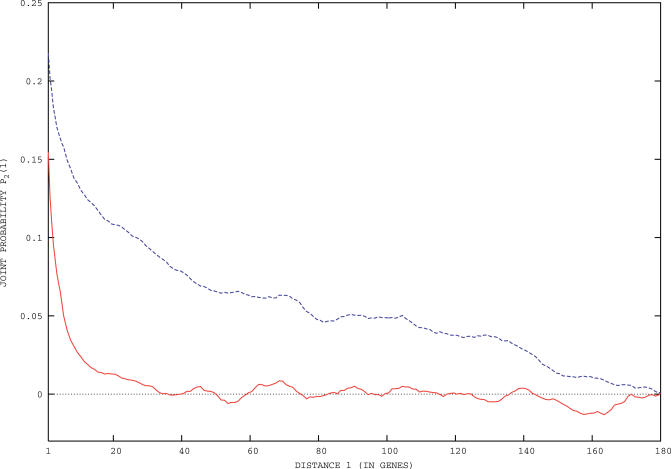
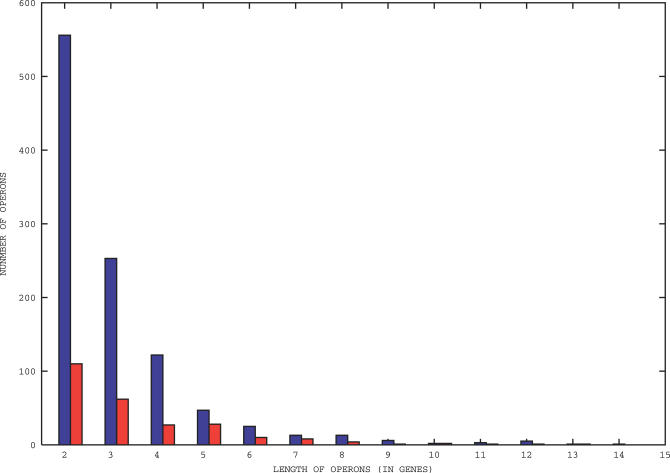
The geography of codon bias distributions over prokaryotic genomes and its impact upon chromosomal organization are analyzed. To this aim, we introduce a clustering method based on information theory, specifically designed to cluster genes according to their codon usage and apply it to the coding sequences of Escherichia coli and Bacillus subtilis. One of the clusters identified in each of the organisms is found to be related to expression levels, as expected, but other groups feature an over-representation of genes belonging to different functional groups, namely horizontally transferred genes, motility, and intermediary metabolism. Furthermore, we show that genes with a similar bias tend to be close to each other on the chromosome and organized in coherent domains, more extended than operons, demonstrating a role of translation in structuring bacterial chromosomes. It is argued that a sizeable contribution to this effect comes from the dynamical compartimentalization induced by the recycling of tRNAs, leading to gene expression rates dependent on their genomic and expression context.


Conflict of interest statement

Competing interests. The authors have declared that no competing interests exist.

Figures

Figure 1
Figure 1. The Cluster Stability Curves, Quantified by the Difference Δ(S) = B(S) − Brandom(S) of the Assignment Probabilities Defined in the Body of the Text, versus the Number of Clusters S
The curves are for B. subtilis (dashed blue) and E. coli K12 (solid red). The retained number of clusters corresponds to the maximum of the stability curve.
Figure 2
Figure 2. Average Posterior Probabilities of Usage for the Codons of Phenylalanine, Threonine, and Valine in the Clusters Identified for E. coli K12 and B. subtilis
E. coli K12, left column; B. subtilis, right column. Clusters are identified by a roman number on the x-axis. The corresponding standard deviations are on the order of a few percent of the average values.
Figure 3
Figure 3. The Posterior Probability Distributions for Three Representative Codons: TTC (Phenylalanine), ACC (Threonine), and GTC (Valine) in the Clusters That We Identified for E. coli K12 and B. subtilis
E. coli K12, left column; B. subtilis, right column. The curves are meant to show that the clusters are well separated by the combined information on the various codons.
Figure 4
Figure 4. A Centered Gaussian Probability Distribution of Unit Variance (Black), Corresponding to the Random Distribution Obtained in the Null Models, and the Values Actually Observed in Our Clusters (Arrows)
Values reported on the abscissae are z-scores, i.e., the deviations to the mean normalized by the standard deviation. Red solid and blue dashed arrows correspond to E. coli K12 and B. subtilis, respectively. Short arrows point to the values of the z-scores that we measure for the fraction of pairs of genes within a common operon and belonging to the same cluster. Long arrows refer to the same quantities for pairs of genes within a common metabolic pathway. Note that, as the Gaussian distribution is meant to show, our z-scores are highly significant, e.g., z score, ≥ 8 ↦ probability = 6 × 10⁻¹⁶ to occur by chance. See also that values of the z-scores previously obtained, using general-purpose clustering methods, were much smaller: 5.30 and 3.29, for operons and metabolic pathways, respectively.
Figure 5
Figure 5. The Distribution of the Number of Genes on the Leading Strand for the Clusters of E. coli K12 and B. subtilis
E. coli is shown on the top graph, and B. subtilis is shown on the lower graph. Clusters are identified by a roman number on the x-axis, and z-scores relative to null models are indicated on the y-axis. Note the depletion of leading strand genes in the third cluster of B. subtilis.
Figure 6
Figure 6. The Correlation Function (1) of Cluster Memberships versus the Distance among Genes for B. subtilis and E.coli K12
Blue dashed lines are for B. subtilis, and red solid lines are for E. coli.
Figure 7
Figure 7. The Histograms of Lengths of the Known Operons for B. subtilis and E. coli K12
Blue boxes are for B. subtilis, and red boxes are for E. coli K12.

References

    1. Post L, Nomura M. DNA sequences from the str operon of Escherichia coli. J Biol Chem 255: 4660–4666; 1980. Available: http://www.jbc.org/cgi/content/abstract/255/10/4660. Accessed 20 March 2006. - PubMed
    1. Grantham R, Gautier C, Gouy M, Jacobzone M, Mercier R. Codon catalog usage is a genome strategy modulated for gene expressivity. Nucleic Acids Res. 1981;9:r43–r74. - PMC - PubMed
    1. Ikemura T. Correlation between the abundance of Escherichia coli tRNAs and the occurrence of the respective codons in its protein genes. J Mol Biol. 1981;146:1–21. - PubMed
    1. Ikemura T. Correlation between the abundance of yeast tRNAs and the occurrence of the respective codons in protein genes: Differences in synonymous codon choice patterns of yeast and Escherichia coli with reference to the abundance of isoaccepting tRNAs. J Mol Biol. 1982;158:573–597. - PubMed
    1. Sharp P, Li W. The codon adaptation index—A measure of directional synonymous codon usage bias, and its potential applications. Nucleic Acids Res. 1987;15:1281–1295. - PMC - PubMed

MeSH terms