Positive selection, relaxation, and acceleration in the evolution of the human and chimp genome
- PMID: 16683019
- PMCID: PMC1447656
- DOI: 10.1371/journal.pcbi.0020038
Positive selection, relaxation, and acceleration in the evolution of the human and chimp genome
Abstract
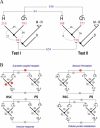
For years evolutionary biologists have been interested in searching for the genetic bases underlying humanness. Recent efforts at a large or a complete genomic scale have been conducted to search for positively selected genes in human and in chimp. However, recently developed methods allowing for a more sensitive and controlled approach in the detection of positive selection can be employed. Here, using 13,198 genes, we have deduced the sets of genes involved in rate acceleration, positive selection, and relaxation of selective constraints in human, in chimp, and in their ancestral lineage since the divergence from murids. Significant deviations from the strict molecular clock were observed in 469 human and in 651 chimp genes. The more stringent branch-site test of positive selection detected 108 human and 577 chimp positively selected genes. An important proportion of the positively selected genes did not show a significant acceleration in rates, and similarly, many of the accelerated genes did not show significant signals of positive selection. Functional differentiation of genes under rate acceleration, positive selection, and relaxation was not statistically significant between human and chimp with the exception of terms related to G-protein coupled receptors and sensory perception. Both of these were over-represented under relaxation in human in relation to chimp. Comparing differences between derived and ancestral lineages, a more conspicuous change in trends seems to have favored positive selection in the human lineage. Since most of the positively selected genes are different under the same functional categories between these species, we suggest that the individual roles of the alternative positively selected genes may be an important factor underlying biological differences between these species.
Conflict of interest statement
Figures


References
-
- Gillespie JH. The causes of molecular evolution. Oxford: Oxford University Press; 1991. 336. p.
-
- Kimura M. Evolutionary rate at the molecular level. Nature. 1968;217:624–626. - PubMed
-
- Kimura M. The neutral theory of molecular evolution. Cambridge/London: Cambridge University Press; 1983. 367. p.
-
- King JL, Jukes TH. Non-Darwinian evolution. Science. 1969;164:788–798. - PubMed
-
- Li WS. Molecular evolution. Sunderland (Massachusetts): Sinauer Associates; 1997.
Publication types
MeSH terms
LinkOut - more resources
Full Text Sources

