. 2006 Apr;2(4):e30.
doi: 10.1371/journal.pgen.0020030. Epub 2006 Apr 28.

Heterotachy in mammalian promoter evolution

Affiliations

Heterotachy in mammalian promoter evolution

Martin S Taylor et al. PLoS Genet. 2006 Apr.

Abstract

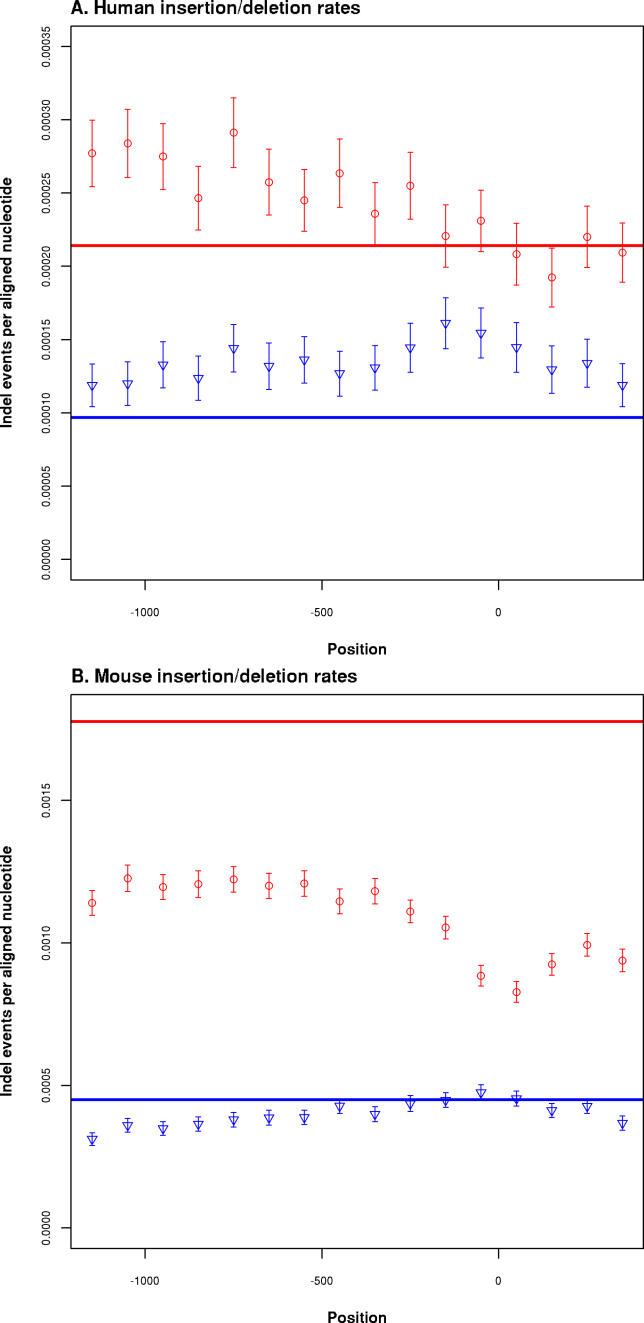
We have surveyed the evolutionary trends of mammalian promoters and upstream sequences, utilising large sets of experimentally supported transcription start sites (TSSs). With 30,969 well-defined TSSs from mouse and 26,341 from human, there are sufficient numbers to draw statistically meaningful conclusions and to consider differences between promoter types. Unlike previous smaller studies, we have considered the effects of insertions, deletions, and transposable elements as well as nucleotide substitutions. The rate of promoter evolution relative to that of control sequences has not been consistent between lineages nor within lineages over time. The most pronounced manifestation of this heterotachy is the increased rate of evolution in primate promoters. This increase is seen across different classes of mutation, including substitutions and micro-indel events. We investigated the relationship between promoter and coding sequence selective constraint and suggest that they are generally uncorrelated. This analysis also identified a small number of mouse promoters associated with the immune response that are under positive selection in rodents. We demonstrate significant differences in divergence between functional promoter categories and identify a category of promoters, not associated with conventional protein-coding genes, that has the highest rates of divergence across mammals. We find that evolutionary rates vary both on a fine scale within mammalian promoters and also between different functional classes of promoters. The discovery of heterotachy in promoter evolution, in particular the accelerated evolution of primate promoters, has important implications for our understanding of human evolution and for strategies to detect primate-specific regulatory elements.


Conflict of interest statement

Competing interests. The authors have declared that no competing interests exist.

Figures

Figure 1
Figure 1. High-Resolution Pairwise Substitution Rate Estimates (K) across Promoter Region Alignments
The x-axis denotes nucleotide position relative to the TSS reference position at +1 (grey vertical line). Error bars (lighter shading) show 95% confidence intervals for each data point. (A) Rates calculated from mouse-based alignments. (B) Rates calculated from human-based alignments.
Figure 2
Figure 2. Relative Selective Constraint across Mammalian Promoters
(A) Nucleotide substitution rates (K, substitutions per aligned nucleotide) calculated from AR alignments. Rates for each branch are shown along the branch where possible, otherwise in parentheses after the species abbreviation. A single black spot indicates the branch length 0.0192, which could not be accommodated on the graph. (B–H) Pairwise substitution rate estimates (with 95% confidence intervals indicated) showing both the substitution rate (K, y-axis) calculated from ARs (red) and at each nucleotide position across the promoter region (position shown on the x-axis). In every case, the 95% confidence interval for ARs is contained within the plotted line. The TSS position at +1 is indicated by a grey vertical line. (B–D) Mouse-based alignments of TSSs defined in mouse. (E–H) Human-based alignments of TSSs defined in human. Cf, Canis familiaris; Hs, Homo sapiens; Mac, Macaca mullata; Mm, Mus musculus; Pt, Pan troglodytes; Rn, Rattus norvegicus.
Figure 3
Figure 3. Micro-Insertion and -Deletion Rates
Promoter rates calculated as insertion (blue) and deletion (red) events per nucleotide in 100-bp consecutive windows (x-axis). Error bars show 95% confidence intervals; solid horizontal lines show rates calculated from AR alignments. Vertical grey line indicates the +1 TSS position. (A) Human rates based on alignments between human, chimpanzee, and macaque; rates shown are derived only from the human terminal branch (see Materials and Methods). (B) Mouse terminal branch rates based on comparisons between mouse, rat, and dog.
Figure 4
Figure 4. Patterns of Evolution in Promoter Subcategories
(A) The percentage of all mouse TSSs assigned to each category. Dark blue shows the percentage assigned to the category annotated to the left, and light blue the reciprocal category (e.g., non-CpG is the reciprocal of CpG). The colour coding is consistent with (B–E). The “map” category refers to whether the TSS could be mapped to the annotated 5′-most end of a known protein-coding gene (dark blue), could not mapped to a gene (light blue), or maps internally to an annotated gene extent (grey). See Materials and Methods for details of category assignment. (B–E) Single nucleotide resolution estimates of substitution rates calculated from promoters assigned to the indicated categories. Only rates calculated from mouse–dog comparisons are shown. The 95% confidence intervals have been excluded for clarity. Red horizontal lines show K for ARs, nucleotide position is shown on the x-axis relative to the TSS at +1 (grey vertical line), and K is shown on the y-axis. Although there are three categories indicated for gene mapping in (A), only two are shown for clarity.

Similar articles

Cited by

References

    1. Lee TI, Young RA. Transcription of eukaryotic protein-coding genes. Annu Rev Genet. 2000;34:77–137. - PubMed
    1. Lettice LA, Horikoshi T, Heaney SJ, van Baren MJ, van der Linde HC, et al. Disruption of a long-range cis-acting regulator for Shh causes preaxial polydactyly. Proc Natl Acad Sci U S A. 2002;99:7548–7553. - PMC - PubMed
    1. Trinklein ND, Aldred SJ, Saldanha AJ, Myers RM. Identification and functional analysis of human transcriptional promoters. Genome Res. 2003;13:308–312. - PMC - PubMed
    1. Hoogendoorn B, Coleman SL, Guy CA, Smith K, Bowen T, et al. Functional analysis of human promoter polymorphisms. Hum Mol Genet. 2003;12:2249–2254. - PubMed
    1. Lenhard B, Sandelin A, Mendoza L, Engstrom P, Jareborg N, et al. Identification of conserved regulatory elements by comparative genome analysis. J Biol. 2003;2:13. - PMC - PubMed

Publication types