. 2006 Apr;2(4):e45.
doi: 10.1371/journal.pgen.0020045. Epub 2006 Apr 28.

A simple physical model predicts small exon length variations

Affiliations

A simple physical model predicts small exon length variations

Tzu-Ming Chern et al. PLoS Genet. 2006 Apr.

Abstract

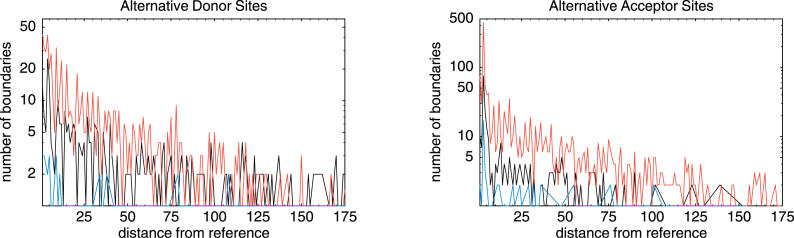
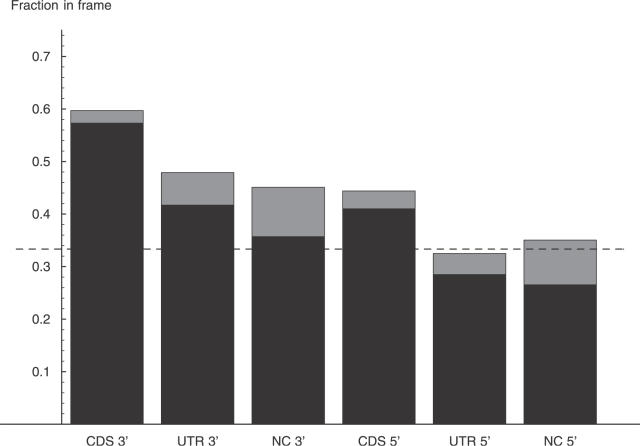
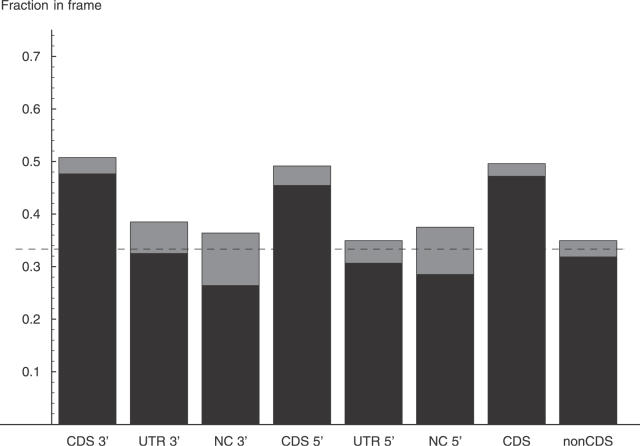
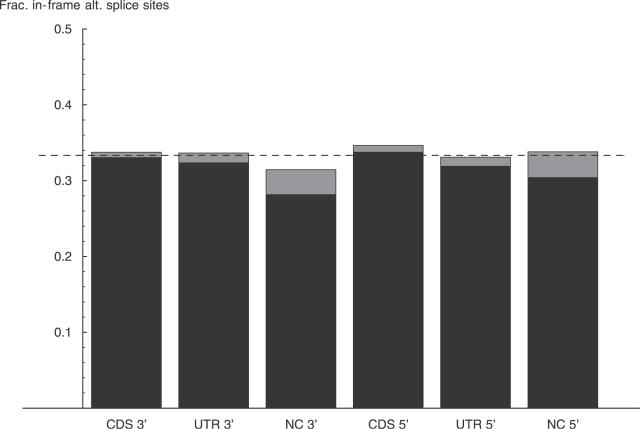
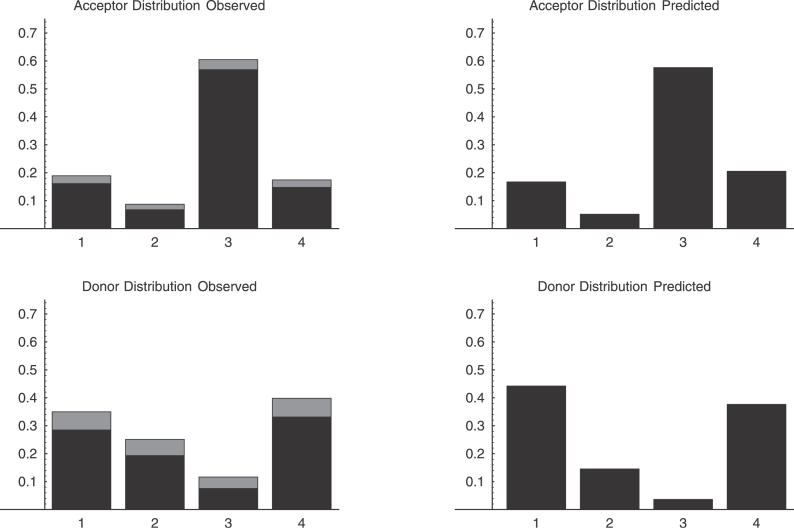
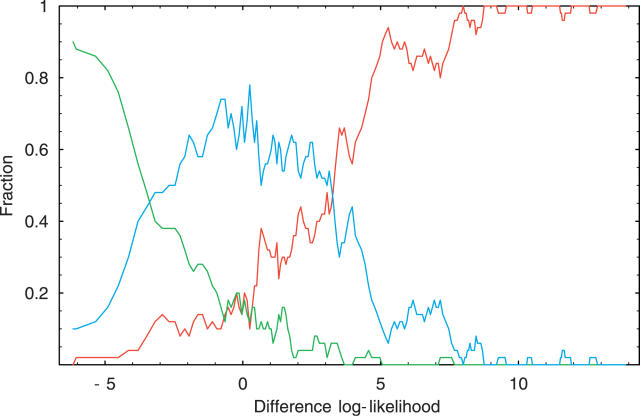
One of the most common splice variations are small exon length variations caused by the use of alternative donor or acceptor splice sites that are in very close proximity on the pre-mRNA. Among these, three-nucleotide variations at so-called NAGNAG tandem acceptor sites have recently attracted considerable attention, and it has been suggested that these variations are regulated and serve to fine-tune protein forms by the addition or removal of a single amino acid. In this paper we first show that in-frame exon length variations are generally overrepresented and that this overrepresentation can be quantitatively explained by the effect of nonsense-mediated decay. Our analysis allows us to estimate that about 50% of frame-shifted coding transcripts are targeted by nonsense-mediated decay. Second, we show that a simple physical model that assumes that the splicing machinery stochastically binds to nearby splice sites in proportion to the affinities of the sites correctly predicts the relative abundances of different small length variations at both boundaries. Finally, using the same simple physical model, we show that for NAGNAG sites, the difference in affinities of the neighboring sites for the splicing machinery accurately predicts whether splicing will occur only at the first site, splicing will occur only at the second site, or three-nucleotide splice variants are likely to occur. Our analysis thus suggests that small exon length variations are the result of stochastic binding of the spliceosome at neighboring splice sites. Small exon length variations occur when there are nearby alternative splice sites that have similar affinity for the splicing machinery.


Conflict of interest statement

Competing interests. The authors have declared that no competing interests exist.

Figures

Figure 1
Figure 1. The Number of Splice Events Involving Alternative Donor and Acceptor Sites at a Specified Distance Relative to the Reference (Most Commonly Used) Splice Site
The horizontal axis shows the distance from the reference splice site corresponding to each genomic exon for both donor sites (left) and acceptor sites (right). The red lines correspond to coding exons, the black lines to UTR exons, and the blue lines to exons from non-protein-coding transcription units. The vertical axis is shown on a logarithmic scale.
Figure 2
Figure 2. Proportion of In-Frame Variations at Donor and Acceptor Splice Sites That Are Located within CDS, UTR, and Noncoding Regions
This figure shows the fractions of alternative splice events that lead to an in-frame shift with respect to the reference boundary at acceptor (3′) and donor (5′) splice sites of CDS, UTR, and noncoding (NC) exons. The estimated fraction is in the middle of the gray bar, with the gray bar indicating two standard errors. The dashed line shows the fraction 1/3 that would be expected by chance.
Figure 3
Figure 3. Proportion of In-Frame Variations of More Than Four Nucleotides at Donor and Acceptor Sites Located within CDS, UTR, and Noncoding Regions
This figure shows the fractions of alternative splice events that lead to an in-frame shift with respect to the reference boundary at acceptor (3′) and donor (5′) splice sites of CDS, UTR, and noncoding (NC) exons, when only splice events that are more than four nucleotides shifted with respect to the reference boundary are considered. The two rightmost columns show the fractions when the data from all CDS exons and all non-CDS exons are pooled. The estimated fraction is in the middle of the gray bar, with the gray bar indicating two standard errors. The dashed line shows the fraction 1/3 that would be expected by chance.
Figure 4
Figure 4. Proportion of Putative Donor (GT) and Acceptor (AG) Splice Sites That Are Located In-Frame Relative to the Splice Sites in CDS, UTR, and Noncoding Regions
This figure shows the fraction of AG dinucleotides that occur at distance that is a multiple of three in the first 100 intronic bases upstream of acceptor (3′) splice sites of exons that show splice variation at their acceptor sites, and the fraction of GT dinucleotides that occur at a distance that is a multiple of three in the first 100 intronic bases downstream of donor (5′) splice sites of exons that show splice variations at their donor sites. Occurrences of AG or GT within the first four bases flanking the splice sites were not counted. The estimated fraction is in the middle of the gray bar, with the gray bar indicating two standard errors. The dashed line shows the fraction 1/3 that would be expected by chance.
Figure 5
Figure 5. The Distribution of Alternative Splice Events That Are Shifted by One, Two, Three, or Four Nucleotides with Respect to the Reference Splice Site
The two left panels show the observed distributions at acceptor sites (above) and donor sites (below). The estimated relative frequency is in the middle of the gray bar, with the width of the gray bar corresponding to two standard errors. The panels on the right show the predicted relative frequency of alternative splice events of lengths 1–4 based on the splice site WMs and the sequences around exon boundaries that show splice variation.
Figure 6
Figure 6. WMs Representing the Sequence Specificity of the Spliceosome at Invariant Donor and Acceptor Splice Sites
WMs have been constructed from six exonic and six intronic nucleotides flanking each type of splice site. The relative sizes of the letters are proportional to the frequency wαi of each nucleotide α at position i. The total height in each column is given by the information score I = Σα wαi log(4wαi).
Figure 7
Figure 7. Dependency of the Frequency of Alternative Splicing at NAGNAG Sites on the Relative Likelihood of the Two Putative Acceptor Sites
The figure shows the fraction of all NAGNAG boundaries that splice only at the first NAG (red), only at the second NAG (green), or at both NAGs (blue) as a function of the log-likelihood difference of the first and second putative splice sites for the acceptor site WM.

Comment in

References

    1. Lander E, Linton L, Birren B, Nusbaum C, Zody M, et al. Initial sequencing and analysis of the human genome. Nature. 2001;409:860–921. - PubMed
    1. Venter J, Adams M, Myers E, Li P, Mural R, et al. The sequence of the human genome. Science. 2001;291:1304–1351. - PubMed
    1. Waterston R, Lindblad-Toh K, Birney E, Rogers J, Abril J, et al. Initial sequencing and comparative analysis of the mouse genome. Nature. 2002;420:520–562. - PubMed
    1. Kawai J, Shinagawa A, Shibata K, Yoshino M, Itoh M, et al. Functional annotation of a full−length mouse cDNA collection. Nature. 2001;409:685–690. - PubMed
    1. Suzuki Y, Taira H, Tsunoda T, Mizushima−Sugano J, Sese J, et al. Diverse transcriptional initiation revealed by fine, large-scale mapping of mRNA start sites. EMBO Rep. 2001;2:388–393. - PMC - PubMed

Publication types