. 2006 Apr;2(4):e52.
doi: 10.1371/journal.pgen.0020052. Epub 2006 Apr 28.

The abundance of short proteins in the mammalian proteome

Affiliations

The abundance of short proteins in the mammalian proteome

Martin C Frith et al. PLoS Genet. 2006 Apr.

Abstract

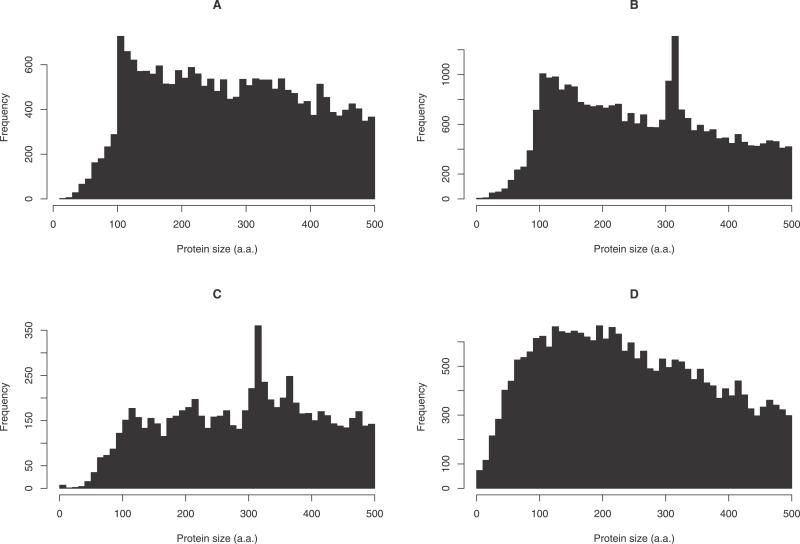
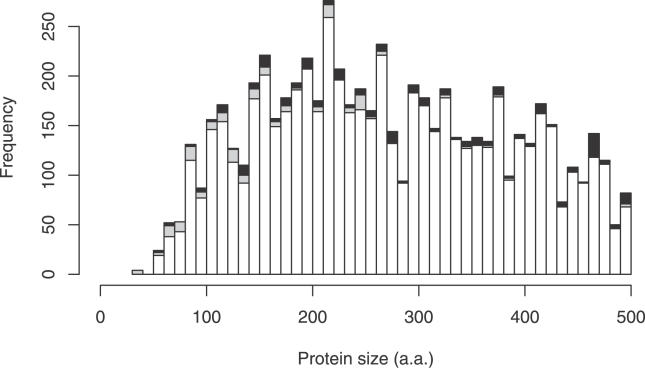
Short proteins play key roles in cell signalling and other processes, but their abundance in the mammalian proteome is unknown. Current catalogues of mammalian proteins exhibit an artefactual discontinuity at a length of 100 aa, so that protein abundance peaks just above this length and falls off sharply below it. To clarify the abundance of short proteins, we identify proteins in the FANTOM collection of mouse cDNAs by analysing synonymous and non-synonymous substitutions with the computer program CRITICA. This analysis confirms that there is no real discontinuity at length 100. Roughly 10% of mouse proteins are shorter than 100 aa, although the majority of these are variants of proteins longer than 100 aa. We identify many novel short proteins, including a "dark matter" subset containing ones that lack detectable homology to other known proteins. Translation assays confirm that some of these novel proteins can be translated and localised to the secretory pathway.


Conflict of interest statement

Competing interests. The authors have declared that no competing interests exist.

Figures

Figure 1
Figure 1. Size Distributions of Mammalian Proteins
(A) For 29,991 full-length mouse proteins from the FANTOM annotations. (B) For 40,865 mouse proteins from the IPI database. (C) For 11,679 human proteins from Swiss-Prot. (D) For 31,035 mouse proteins predicted in the FANTOM cDNAs using CRITICA.
Figure 2
Figure 2. Slight Length Dependence of CRITICA Predictions
Black bars indicate all mouse Swiss-Prot proteins in FANTOM. Grey bars indicate the subset of these that use the most upstream possible start codon. White bars indicate the subset of the mouse Swiss-Prot proteins in FANTOM that are predicted by CRITICA.
Figure 3
Figure 3. Box-and-Whisker Plots of RNA Sizes for Different Ranges of Protein Size
The centre lines indicate the medians, the top and bottom of the boxes indicate the first and third quartiles, and the whiskers extend to the most extreme data points.
Figure 4
Figure 4. Overlap of FANTOM CRITICA Predictions with Genome-Based Gene Predictions Made by Six Methods
Only the 16,900 maximal-length isoforms of the FANTOM CRITICA predictions were considered; these were compared to each genome-based method in turn as follows. Each CRITICA prediction was compared to the genome-based gene prediction that overlapped it by the greatest number of nucleotides, and the degree of overlap was quantified using the performance coefficient: the number of nucleotides in the intersection of the two predictions divided by the number of nucleotides in the union of the predictions [45]. These are box-and-whisker plots: the centre lines indicate the medians, the top and bottom of the boxes indicate the first and third quartiles, and the whiskers extend to the most extreme data points.
Figure 5
Figure 5. Evolutionary Conservation of FANTOM CRITICA Predictions
Only the 16,900 maximal-length isoforms of the FANTOM CRITICA predictions were considered. (A) Histogram of predictions where the reading frame is perfectly conserved in rat (black) or disrupted (white). (B) Histogram of predictions where the reading frame is perfectly conserved in human (black) or disrupted (white). (C and D) Sequence conservation of predictions versus (C) rat and (D) human. Sequence conservation was quantified by the percentage of nucleotides in each predicted protein-coding region that align to identical nucleotides in the other organism. These are box-and-whisker plots: the centre lines indicate the medians, the top and bottom of the boxes indicate the first and third quartiles, and the whiskers extend to the most extreme data points. The long horizontal lines indicate the percentage of sequenced nucleotides in the mouse genome that align to identical nucleotides in the other organism.
Figure 6
Figure 6. Heat Map Displaying Relative Expression Levels of Small-ORF Transcripts Present within 61 Mouse Tissues from the Genomics Institute of the Novartis Research Foundation GeneAtlas
Small-ORF transcripts are clustered on the vertical axis, and tissue samples are along the horizontal axis. All gene expression is displayed relative to the median level of each transcript across all 61 tissues. The coloured columns on the left-hand side of the heat map (left) correspond to the blown up sections (right). FANTOM3 clone identifiers are included in the blown up clusters. A blow-up of the tissue clustering, including the tissue names, is available as Figure S1.
Figure 7
Figure 7. Observed Subcellular Localisations for Small SignalP Positive ORFs Predicted by CRITICA, Fused to GFP
(A–C) Cell surface and peri-nuclear localisations of A430023G14, 1110065P19, and 5430416O09. (D and E) Nuclear envelope and peri-nuclear golgi-like localisations of E030042M04 and 1500009C09. (F) Endoplasmic-reticulum-like staining of C230071E12. (G) Peri-nuclear staining of 0610011H04. (H and I) GFP-like ubiquitous staining of D330006H24 and A630083C19, similar to that observed for 1700084P19, D630042J06, F730009G16, 5430411J08, and D130012G24.

References

    1. Carninci P, Kasukawa T, Katayama S, Gough J, Frith MC, et al. The transcriptional landscape of the mammalian genome. Science. 2005;309:1559–1563. - PubMed
    1. Maeda N, Kasukawa T, Oyama R, Gough J, Frith M, et al. Transcript annotation in FANTOM3: Mouse gene catalog based on physical cDNAs. PLoS Genet. 2006;2:e62. DOI: . - DOI - PMC - PubMed
    1. Kersey PJ, Duarte J, Williams A, Karavidopoulou Y, Birney E, et al. The International Protein Index: An integrated database for proteomics experiments. Proteomics. 2004;4:1985–1988. - PubMed
    1. Waterston RH, Lindblad-Toh K, Birney E, Rogers J, Abril JF, et al. Initial sequencing and comparative analysis of the mouse genome. Nature. 2002;420:520–562. - PubMed
    1. Bairoch A, Apweiler R, Wu CH, Barker WC, Boeckmann B, et al. The Universal Protein Resource (UniProt) Nucleic Acids Res. 2005;33:D154–D159. - PMC - PubMed

Publication types