Comparative Study
. 2006 Apr;2(4):e54.
doi: 10.1371/journal.pgen.0020054. Epub 2006 Apr 28.

Mice and men: their promoter properties

Affiliations
Comparative Study

Mice and men: their promoter properties

Vladimir B Bajic et al. PLoS Genet. 2006 Apr.

Abstract

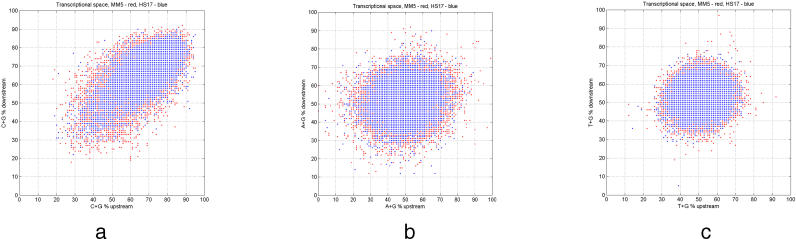
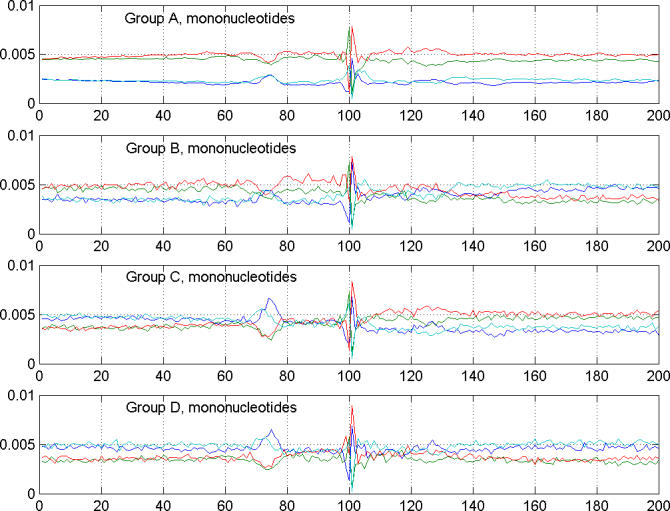
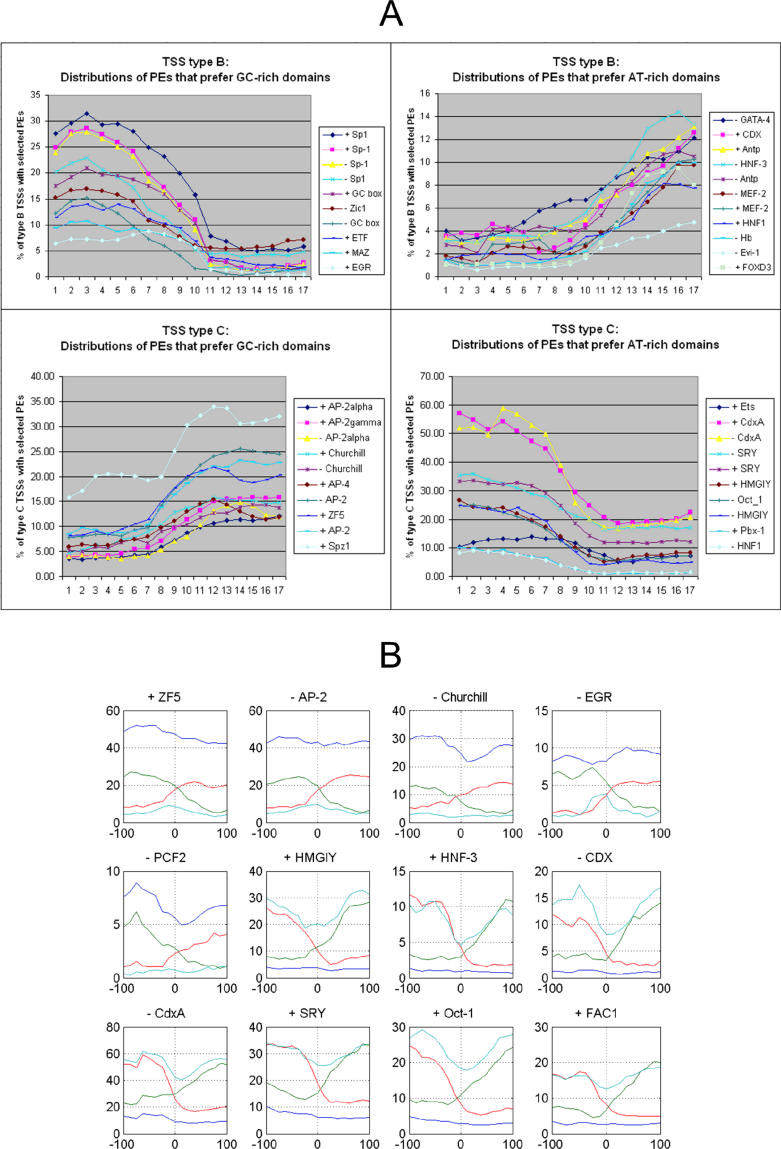
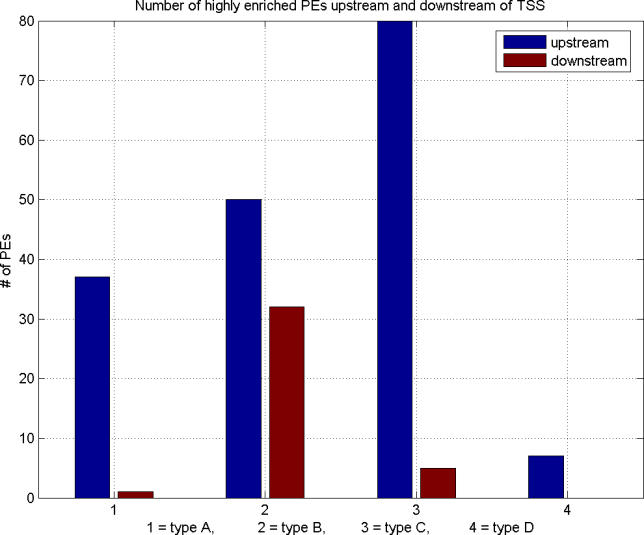
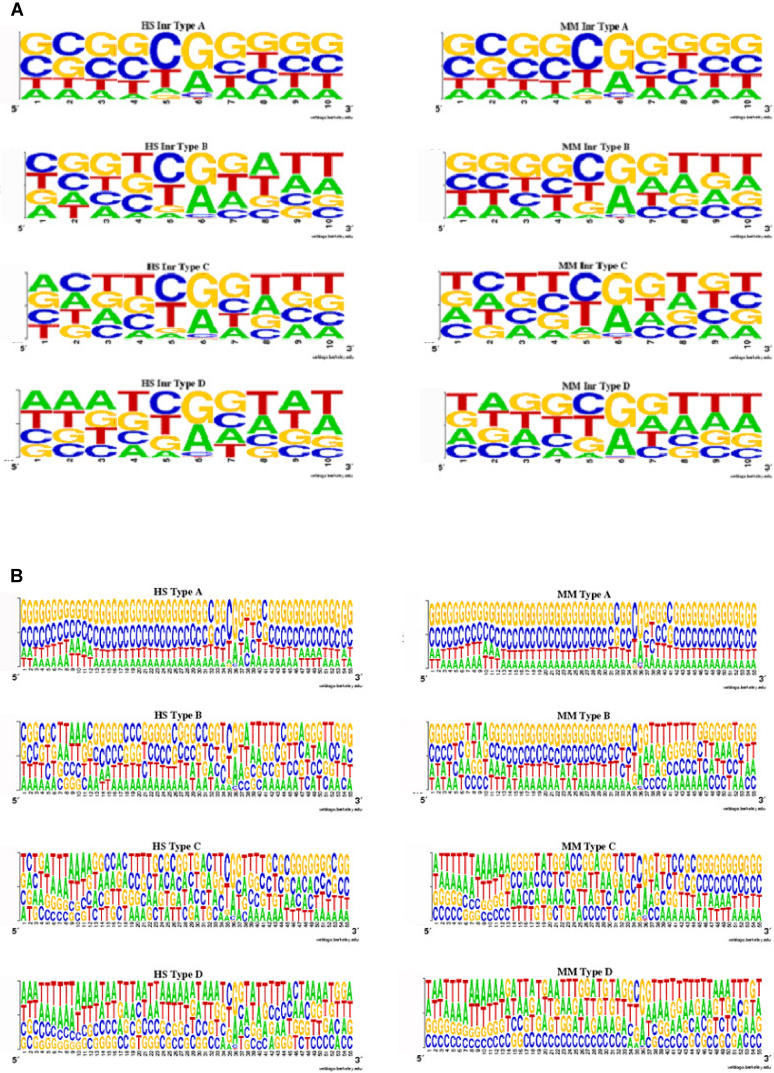
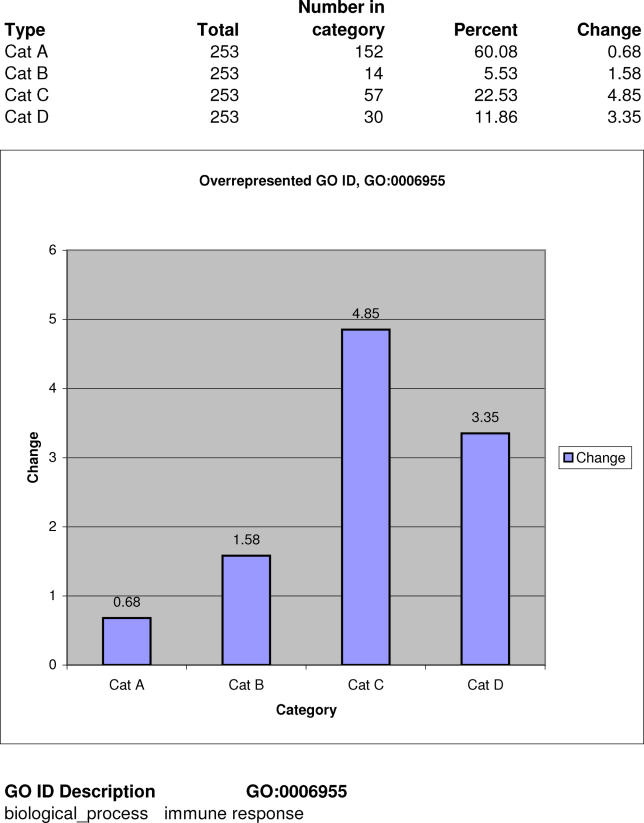
Using the two largest collections of Mus musculus and Homo sapiens transcription start sites (TSSs) determined based on CAGE tags, ditags, full-length cDNAs, and other transcript data, we describe the compositional landscape surrounding TSSs with the aim of gaining better insight into the properties of mammalian promoters. We classified TSSs into four types based on compositional properties of regions immediately surrounding them. These properties highlighted distinctive features in the extended core promoters that helped us delineate boundaries of the transcription initiation domain space for both species. The TSS types were analyzed for associations with initiating dinucleotides, CpG islands, TATA boxes, and an extensive collection of statistically significant cis-elements in mouse and human. We found that different TSS types show preferences for different sets of initiating dinucleotides and cis-elements. Through Gene Ontology and eVOC categories and tissue expression libraries we linked TSS characteristics to expression. Moreover, we show a link of TSS characteristics to very specific genomic organization in an example of immune-response-related genes (GO:0006955). Our results shed light on the global properties of the two transcriptomes not revealed before and therefore provide the framework for better understanding of the transcriptional mechanisms in the two species, as well as a framework for development of new and more efficient promoter- and gene-finding tools.


Conflict of interest statement

Competing interests. The authors have declared that no competing interests exist.

Figures

Figure 1
Figure 1. Transcription Initiation Domains for Mouse and Human
Distribution of mouse (red) TSSs overlapped by human (blue) TSSs based on (A) C + G content, (B) A + G content, and (C) T + G content. Nucleotide content is determined for upstream [−100, −1] and downstream [+1, +100] regions relative to the TSS. The distribution of TSS locations is more or less random when viewed in terms of A + G content (B) or T + G content (C). Strong polarization of distributions is evident only in the G + C case (A).
Figure 2
Figure 2. Distribution of Mononucleotides in Mouse Promoters in the Region Surrounding the TSS
The nucleotides adenine, cytosine, guanine, and thymine are represented by blue, green, red, and light blue, respectively. The TSS types that are GC-poor upstream (C and D) show very characteristic enrichment in adenine and thymine nucleotides around [−35, −20], suggesting a potential dominant influence of TATA box and similar AT-rich elements in transcription initiation in these types. In type B and A TSSs, this influence does not seem to be dominant, but the presence of such elements is suggested by a significant reduction of the GC content in the [−35, −20] region. In principle, one could attempt to link the types of AT-rich upstream elements with initiating dinucleotides characteristic of different TSS types.
Figure 3
Figure 3. Distribution of Densities of Selected PEs in Promoters of the Four TSS Types in Mouse
The density of PEs is calculated from the region covering [−100, +100] relative to the TSS. Density is determined for bins of length 50 bp and shifted by 10 bp. In total, there are 17 bins. The vertical axis shows the percentage of TSSs of the considered type that contain the PE. (A) Distribution of selected PEs that prefer GC-rich (left) and AT-rich (right) domains in type B (above) and type C (below) TSS groups. Bin number 9 is centered around the TSS. It can be seen that groups of PEs change significantly in their concentrations in transition from upstream to downstream regions and characterize two distinct TSS types (B and C). (B) Distribution of selected PEs across all four TSS types. Blue, green, red, and light blue correspond to distributions characterized by type A, B, C, and D TSSs. The first five PEs are those that prefer GC-rich regions, and the last seven PEs prefer AT-rich regions (the plus or minus sign in front of the TFBS symbol denotes the strand where the TFBS is found).
Figure 4
Figure 4. Distribution of Selected Groups of PEs That Are Highly Enriched (at Least 3-Fold) Upstream or Downstream of the TSS
The upstream region considered covers [−100, −1], while the downstream region covers [+1, +100] relative to the TSS. In all TSS types, the upstream region contains significantly more enriched PEs than the downstream region.
Figure 5
Figure 5. Sequence Logos
(A) Sequence logos for Inr in human (left) and mouse (right) obtained using [−5, +5] segments relative to TSS locations. There is an evident bias in the nucleotide composition surrounding the TSS that effectively determines different Inr elements. (B) Sequence logos for segments [−35, +20] relative to TSS locations. Strong similarity exists between human (left) and mouse (right) in TSS type A, while that similarity is considerably reduced for the other TSS types.
Figure 6
Figure 6. Distribution of TSSs for Transcripts Related to Immune Response through GO:0006955
There are 1.58-, 4.85-, and 3.35-fold more transcripts having TSS types B, C, and D than one would expect based on the proportion of transcripts in these groups in our reference mouse data. Enrichment is statistically significant for types C and D based on Bonferroni corrected p-values obtained by the right-sided Fisher's exact test (Table 5).

References

    1. Suzuki Y, Yamashita R, Sugano S, Nakai K. DBTSS, Database of transcriptional start sites: Progress report 2004. Nucleic Acids Res. 2004;32:D78–D81. - PMC - PubMed
    1. Suzuki Y, Yamashita R, Shirota M, Sakakibara Y, Chiba J, et al. Large-scale collection and characterization of promoters of human and mouse genes. In Silico Biol. 2004;4:0036. - PubMed
    1. Aerts S, Thijs G, Dabrowski M, Moreau Y, De Moor B. Comprehensive analysis of the base composition around the transcription start site in metazoan. BMC Genomics. 2004;5:34. - PMC - PubMed
    1. Imanishi T, Itoh T, Suzuki Y, O'Donovan C, Fukuchi S, et al. Integrative annotation of 21,037 human genes validated by full-length cDNA clones. PLoS Biol. 2004;2:e162. DOI: 10.1371/journal.pbio.0020162. - DOI - PMC - PubMed
    1. Carninci P, Kasukawa T, Katayama S, Gough J, Frith MC, et al. The transcriptional landscape of the mammalian genome. Science. 2005;309:1559–1563. - PubMed

Publication types