

Review
doi: 10.1021/cr040425u.
Protein folding thermodynamics and dynamics: where physics, chemistry, and biology meet
Affiliations
- PMID: 16683745
- PMCID: PMC2735084
- DOI: 10.1021/cr040425u
Item in Clipboard
Review
Protein folding thermodynamics and dynamics: where physics, chemistry, and biology meet
Chem Rev.
2006 May.
No abstract available
Figures
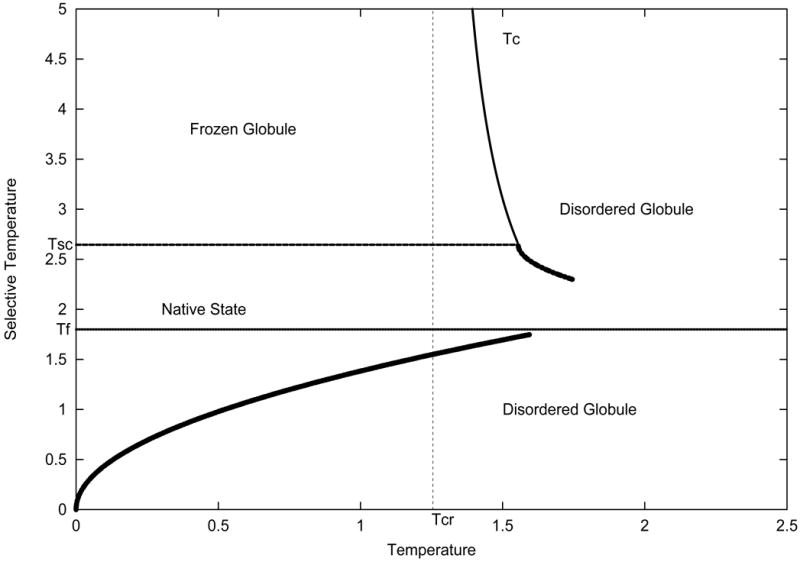
Phase diagram for evolutionary selected protein-like heteropolymers. This phase diagram was derived in for heteropolymers consisting of two types of residues – hydrophobic and polar.. High selective temperature corresponds to random sequences while lower selective temperature corresponds to protein-like evolutionary selected sequences. The transition from native state to disordered compact state is cooperative first order-like and gradual for evolutionary selected sequences (dashed line) and second order for random sequences (solid line around Tc). Reprinted with permission from
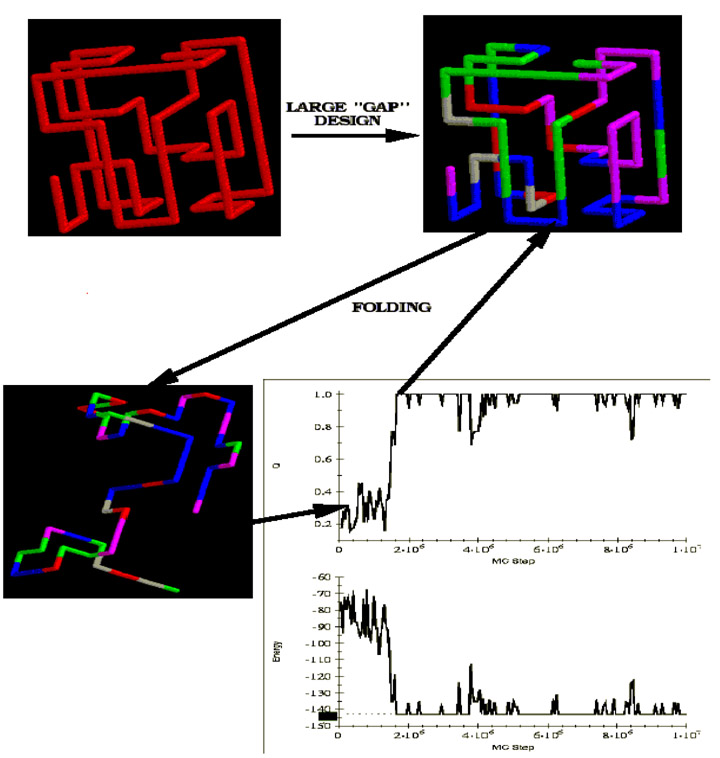
Computational experiment showing that sequences designed with large energy gap fold cooperatively and rapidly into their native conformations. First, a structure is chosen to serve as target, native conformation. Then sequences are designed (using Monte-Carlo search in sequence space with fixed composition) to have large energy difference (gap) between native conformation and set of structurally distinct misfolds. One of such sequences is memorized. Monte-Carlo folding simulations for this sequence start from an arbitrary random coil conformation and quickly and cooperatively converge to the target conformation for which the sequence was designed. The designed sequence has target conformation as its apparent global energy minimum as no conformations with energy lower than that of the target (native) conformation are found.
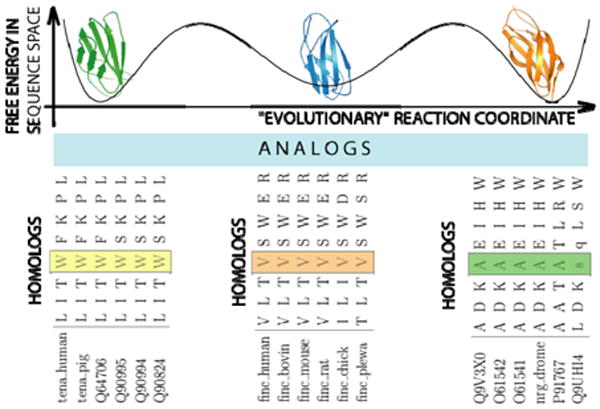
A schematic representation of the evolutionary processes that result in conservation patterns of amino acids. For a given family of folds, e.g. immunoglobulin (Ig) fold in this diagram, there are several alternative minima (3) in the hypothetical free energy landscape in the sequence space as a function of the “evolutionary” reaction coordinate (e.g. time). Each of these minima are formed by mutations in protein sequences at some typical time scales, τ0, that do not alter the protein's thermodynamically and/or kinetically important sites, forming families of homologous proteins. Transitions from one minimum to another occur at time scales τ = τ0 exp(ΔG / T), where ΔG is the free energy barrier in sequence space separating one family of homologous proteins from another. At time scale τ mutations occur that would alter several amino acids at the important sites of the proteins in such a way that the protein properties are not compromised. At time scale τ the family of analogs is formed. In three minima we present three families of homologs (1TEN, 1FNF, and 1CFB) each comprised of six homologous proteins. We show 8 positions in the aligned proteins: from 18 to 28. It can be observed that at position 4 (marked by blocks) in each of the families presented in the diagram amino acids are conserved within each family of homologs, but vary between these families. This position corresponds to position 21 in Ig fold alignment (to 1TEN) and is conserved. We are very grateful to Nikolay Dokholyan for preparation of this figure.
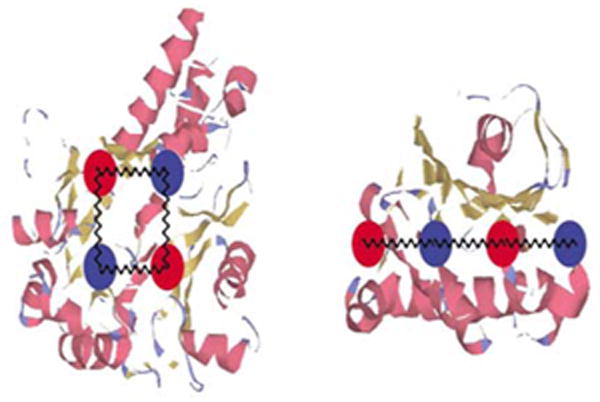
An illustration of the physical reasons of why and how structure of a protein determines its designability. The balls schematically represent amino acids. Suppose that the interaction between the “red” amino acid and the “blue” amino acid is favorable and gives E = - 1. The configuration on the left yields lower energy –4, compared with right structures where contribution from interactions between these amino acids is only –3. Thus the 4-loop in the left structure contributes more to the stability of the structure overall allowing more freedom to select the remaining part of the sequence to obtain overall stabilization of the structure, Similar considerations apply to 3-loops, 5-loops etc. Reprinted with permission from .
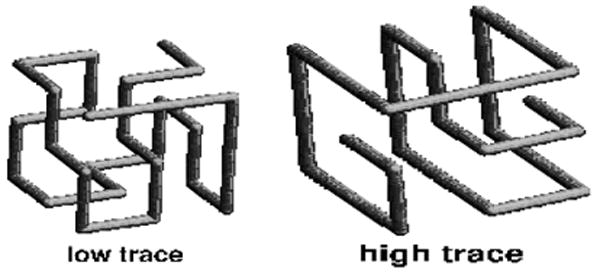
(a) Two lattice structures – having highest and lowest predicted (by traces of their contact matrices) designabilities - and (b) counting of sequences that can fold into these structures with given energy. ΔS is entropy (log) of the number of sequences that fold into a given structure with a given energy counted from fully unconstrained statistics (at E=0). Blue points describe entropy of sequences designed for the low trace structure and red points are for high trace structure. The insert shows how many sequences can be stable (i.e. have high Boltzmann probability) in less and more designable structures respectively.
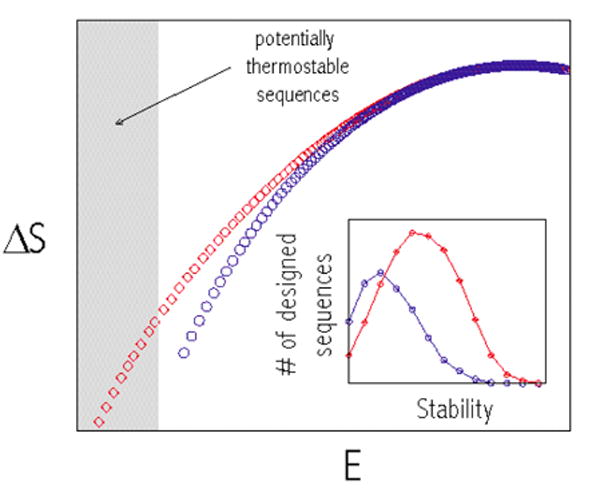
(a) Two lattice structures – having highest and lowest predicted (by traces of their contact matrices) designabilities - and (b) counting of sequences that can fold into these structures with given energy. ΔS is entropy (log) of the number of sequences that fold into a given structure with a given energy counted from fully unconstrained statistics (at E=0). Blue points describe entropy of sequences designed for the low trace structure and red points are for high trace structure. The insert shows how many sequences can be stable (i.e. have high Boltzmann probability) in less and more designable structures respectively.
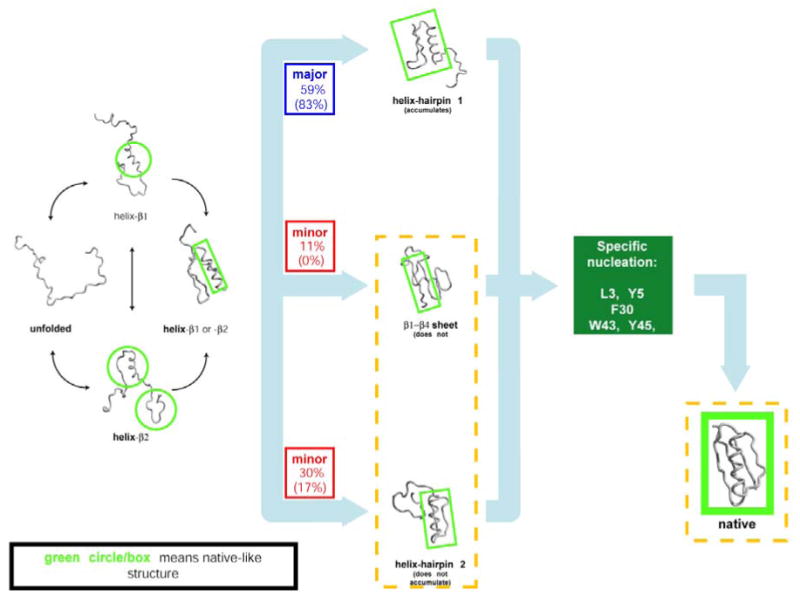
Mechanism of folding of small protein G as derived from all-atom Monte-Carlo ensemble folding simulations with Go potential . Parallel pathways through various helix-hairpin intermediates converge to common nucleation step that leads to final folding step. Reprinted with permission from
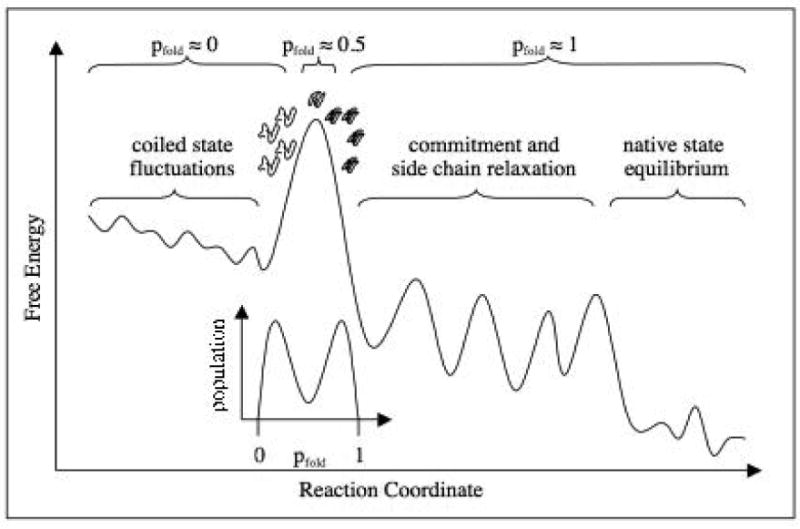
A schematic representation of the putative free energy landscape and idea of pfold. The transition state ensemble corresponds to the set of conformations at the “top” of free energy barrier (saddle point on free energy landscape). Passing the top of the barrier from unfolded to folded direction changes the dynamic behavior of the folding protein: it becomes committed to (in average) downhill folding. Folding dynamics starting from conformations on the “folded” side of the barrier always (apart from unlikely recrossing event) ends in the native basin, hence for these conformations probability to fold is 1. On the other hand folding dynamics that starts from conformations on the “unfolded” side of the barrier ends inevitably in the unfolded state; for such conformations pfold=0. Conformations that belong to the barrier, i.e. transition state ensemble, have equal probability to fold and to unfold; for them pfold=1/2. A rigorous definition of the Transition State Ensemble (TSE) is collection of conformations having pfold=1/2. A detailed discussion of how to define and determine pfold in realistic all-atom simulations can be found in . An insert shows that ensemble distribution of pfold is bimodal with TSE conformations corresponding to minimum probability. The hypothetical plot here is shown along hypothetical “reaction coordinate” for which the top of the barrier coincides with the TSE. The identity or even existence of such reaction coordinate is not known. Reprinted with permission from .
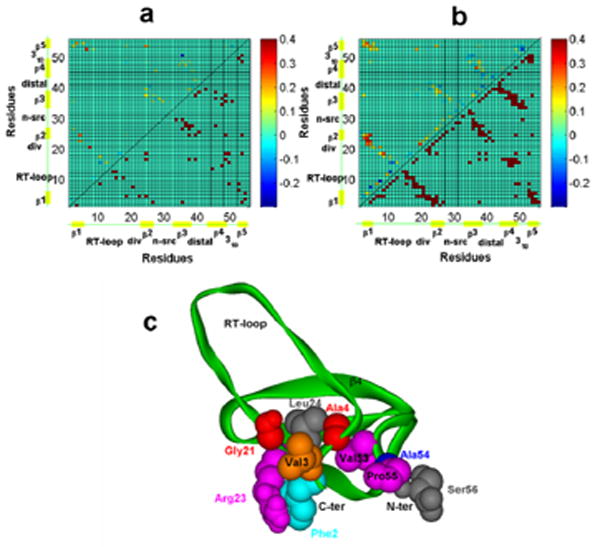
Differential contact maps between pre-TS ensemble and TSE for src SH3 domain folding (upper panels). (a) – for contacts between geometric centers of side chains, (b) – for contacts between Cβ atoms. Lower panels on both contact maps correspond to native structure of the SH3 domain. (c) – Cartoon diagram of a sample TS structure determined by pfold analysis. Residues with contact probabliy change from pre-TSE to TSE (as shown on upper panel of (b) greater than 0.1 are shown in space-filling scheme. They constitute a polarized folding nucleus for this domain. The figure and analysis are from
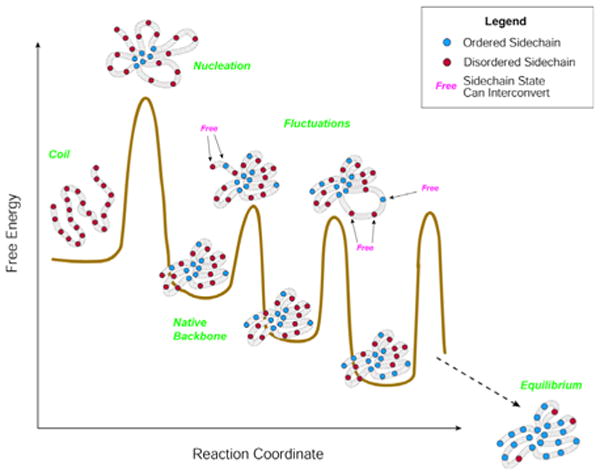
A Schematic representation of full dynamic process of folding that includes side-chain organization. The main nucleation barrier is overcome first and leads to establishment of the overall fold. Subsequent dynamics includes local fluctuations of the backbone accompanied by progressive freezing of side-chains. Barrier heights are shown for illustrative purposes only and may be exaggerated and not representative of real situation. Reprinted with permission from
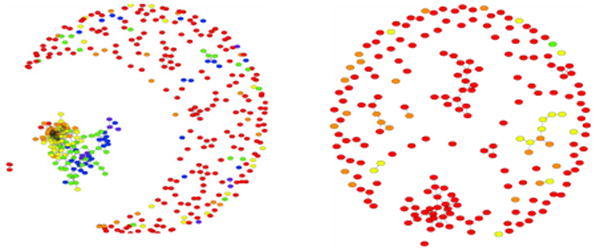
Clustering of 200 conformations obtained in 200 independent simulation runs of all-atom MC folding algorithm with sequence-based transferable atomic μ-potential for protein A (1BDD). Each node corresponds to the lowest energy conformation obtained in each run and an edge is drawn between any two conformations if RMSD between them is less than 3.5A. Color code indicates RMSD from the native structure: purple: < 4A, blue: <5A, green: < 6A, yellow < 7A,orange< 8A, red: > 8A The central cluster- giant component – contains all native-like structures, while “peripheral” nodes are mostly misfolds. Figure on the right shows control: clustering of 200 conformations obtained in the same way but for random sequence with the same composition as for 1BDD. Comparison clearly shows that we observe sequence-guided non-trivial folding and that clustering focuses landscape for real sequence towards correct native structure. Reprinted with permission from
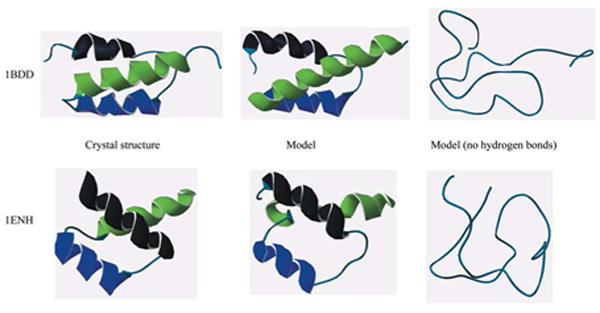
Protein models from the PDB and representatives from simulation. Model simulations with full energy function (μ-potential pairwise interaction+ hydrogen bonding) fold to near native conformations while simulations without hydrogen bonding collapse without helices. Excluded volume and an attractive potential ensure a protein-like hydrophobic core and sidechain packing. However, representation of hydrogen bonding interactions is essential for formation of secondary structure
References
-
- Mirny L, Shakhnovich E. Annu Rev Biophys Biomol Struct. 2001;30:361. - PubMed
-
- Onuchic JN, Luthey-Schulten Z, Wolynes PG. Annu Rev Phys Chem. 1997;48:545. - PubMed
-
- Plotkin SS, Onuchic JN. Q Rev Biophys. 2002;35:205. - PubMed
-
- Shea JE, Brooks CL., 3rd Annu Rev Phys Chem. 2001;52:499. - PubMed
-
- Shakhnovich EI, Gutin AM. Biophys Chem. 1989;34:187. - PubMed
Publication types
MeSH terms
Substances
Grants and funding
LinkOut - more resources
Full Text Sources
