Review
. 2006 May;106(5):1672-99.
doi: 10.1021/cr040422h.

Characterization of the fast dynamics of protein amino acid side chains using NMR relaxation in solution

Affiliations
Review

Characterization of the fast dynamics of protein amino acid side chains using NMR relaxation in solution

Tatyana I Igumenova et al. Chem Rev. 2006 May.
No abstract available


Figures

Figure 1
Figure 1
Schematic illustration of the Lipari-Szabo model-free internal autocorrelation function describing the motion of a nuclear spin interaction vector within the molecular frame of an isotropically tumbling macromolecule. The square of the generalized order parameter (O2) defines the contribution of internal motion to the decay of the autocorrelation function. The effective correlation time (τe) is defined as the normalized area under the internal correlation function. This particular example was simulated with O2 of 0.5, τe of 200 ps and an isotropic global reorientation correlation time (τm) of 10 ns. Note, the original Lipari-Szabo treatment utilizes the symbol S to denote the generalized order parameter. To avoid confusion with the similar symbol corresponding to entropy we shall employ O throughout to denote the generalized order parameter.
Figure 2
Figure 2
Motional dependence of the deuterium relaxation parameters observable using the two dimensional 1H-13C sampling approach of Kay and coworkers. Shown are simulations of the five deuterium relaxation parameters in methyl groups as a function of various model-free descriptors of internal motion. Note that the raw squared generalized order parameter is given, which is divided by 0.111 to give the derived Oaxis2 parameter. Inset rates are given in s−1.
Figure 3
Figure 3
Correlation of experimentally determined methyl-group dynamics with several primitive structural parameters. Methyl group symmetry axis squared generalized order parameters ( Oaxis2) determined by deuterium relaxation were obtained from the literature (Table 2). Structural parameters were obtained from structural models determined by crystallography (black symbols) or by NMR spectroscopy (red symbols). Panel A: Correlation of Oaxis2 with depth of burial. Depth of burial was calculated by determination of the shortest distance between the methyl carbon and a molecular surface created with a rolling sphere (1.4 Å radius) utilizing the GRASP program. Panel B: Correlation of Oaxis2 with solvent accessible surface area. The solvent accessible surface area was determined using a rolling sphere with a radius of 1.4 Å. Panel C: Correlation of Oaxis2 with packing density as determined by subtraction of the van der Waals volume of the methyl group from the volume of the Vonoroi polyhedral. Packing density was determined only for buried sites (i.e. atoms with completed Vonoroi polyhedra). Panel D: Correlation of Oaxis2 with crystallographic B-factors. In no case does the R2 of the best fitted line to any of these datasets exceed 0.05.
Figure 4
Figure 4
The distribution of amplitude of fast motion of methyl groups in a calmodulin-peptide complex. Shown is a ribbon representation of the backbone of the crystal structure (1CDL) of the complex between calcium-saturated calmodulin and a peptide representing the calmodulin-binding domain of the smooth muscle myosin light chain kinase. Methyl groups are represented by spheres that are color-coded according to their Oaxis2 parameter determined by deuterium relaxation. Note the circled methyl groups illustrating that being on the surface of the protein does not necessarily result in extensive amplitude of motion nor does complete burial necessarily result in highly restricted motion.
Figure 5
Figure 5
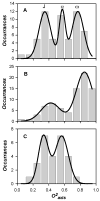
Histograms of the distribution of squared generalized order parameters of methyl group symmetry axes ( Oaxis2) in A) the complex of calcium-saturated calmodulin and a peptide derived from the calmodulin-binding domain of the smooth muscle myosin light chain kinase, B) flavodoxin and C) α3d, a protein of de novo design. Lines are best fits to a sum of three Gaussians for A), giving R2 =0.989; a sum of two Gaussains for B) and C), giving R2 =0.9991 and 0.986, respectively.
Figure 6
Figure 6
The dependence of the squared generalized order parameter and entropy on rotamer averaging. The curves were constructed using the potential energy function U (θ) = b0 + b1 cos(θ) + b2 cos(3θ). The constant b1 was set to 8 kT. The constant b2 = ΔUwell/1.5 and b0 = b1 + b2. ΔUwell was varied from 0 to 8 kT in steps of 0.5 kT. This function defines three wells, two of which are degenerate. ΔUwell defines the energy gap between the two degenerate wells and the third well. The lowermost curve corresponds to ΔUwell of zero. Shown is the fractional occupancy of the major rotomer (●;), the value of O2 (○) and the difference in entropy from the high ΔUwell limit (▼). Reproduced with permission from Biochemistry 2002, 41, 13814–25. Copyright 2002 American Chemical Society.
Figure 7
Figure 7
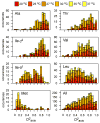
Histograms of the distribution of of squared generalized order parameters of methyl group symmetry axes ( Oaxis2) of the five types of methyl-bearing amino acid side chains in proteins. The Oaxis2 reported in the literature as summarized in Table 2 have been used. Because methyl group dynamics have a significant temperature dependence, Oaxis2 parameters are identified with the temperature at which they were determined. In general, short chains tend to be more motionally restricted whereas longer side chains tend to have higher amplitudes of motion.
Figure 8
Figure 8
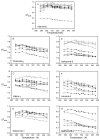
Temperature dependence of side chain methyl Oaxis2 parameters of calmodulin in complex with the smMLCKp peptide. Panel a, the methyl Oaxis2 parameters determined for the beta methyl groups of alanines: A10 (●), A15 (○), A46 (▼), A73 (▽), A88 (■), A102 (□), A103 (◆), A128 (◇), and A147 (▲). Panel b, the methyl Oaxis2 parameters determined for the gamma methyl groups of threonines: T26 (●), T29 (○), T34 (▼), T70 (▽), T79 (■), T110 (□), and T146 (◆). Panel c, the methyl Oaxis2 parameters determined for the gamma methyl groups of valines: V35-γR (●), V35-γS (○), V55-γR (▼), V55-γS (△), V108-γR (■), V108-γS (□), and V121-γR (◆), V136-γR (◇), V142-γR (▲), and V142-γS. Panel d, the methyl Oaxis2 parameters determined for isoleucine-γ methyls: I27 (●), I52 (○), I63 (▼), I85 (△), I125 (■), and I130 (□). Panel e, the methyl Oaxis2 parameters determined for isoleucine-δ methyls: I9 (●), I27 (○), I52 (▼), I63 (▽), I85 (■), I100 (□), I125 (◆), and I130 (◇). Panel f, the methyl Oaxis2 parameters determined for leucine-δ methyls: L18δS (●), L39δR (○), L39δS (▼), L69δR (▽), L105δR (■), L112δS (□), and L116δR (◆). Panel g, the methyl Oaxis2 parameters determined for methionine-δ methyls: M71 (●), M72 (○), M76 (▼), M109 (▽), M124 (■), M144 (□), and M145 (◆). In many cases the error bars are less than dimensions of the symbol. Reproduced with permission from Biochemistry 2002, 41, 13814–25. Copyright 2002 American Chemical Society.
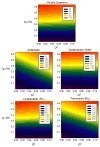
Figure 9
Figure 9
Temperature dependence of the O2 parameter for a site moving in an infinite square well (SQ), quadratic (U2), quartic (U4), sixth-power (U6) or stepped square well (ST) potential. The models have been parameterized to give a O2 parameter value of 0.65 at a temperature of 15 °C. From Lee and coworkers. Reproduced with permission from Biochemistry 2002, 41, 13814–25. Copyright 2002 American Chemical Society.
Figure 10
Figure 10
Temperature dependence of O2 parameters of sites attached to four interacting side chains in a two dimensional cluster model (inset). The green side chains (1 and 3) have the same temperature dependence (○), the stiff red side chain (▼) and floppy blue side chain (▽) have negative and positive temperature dependencies, respectively. Adapted from Lee and coworkers. Reproduced with permission from Biochemistry 2002, 41, 13814–25. Copyright 2002 American Chemical Society.
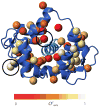
Figure 11
Figure 11
A simple schematic illustration of allosteric mechanisms based solely on a change in atomic coordinates of the protein (a) and one based solely on entropic effects (b) manifested in the dynamics of the protein. Structure-based allostery is the current paradigm but as pointed out by Cooper & Dryden (1984) a change in conformational entropy also provides a plausible mechanism for creation of allosteric free energy changes in proteins. Only small changes in the breadth of the conformational distribution would be required if a large number of motional modes are involved. In principle, both mechanisms could be operative (c). Adapted from Wand. Reprinted by permission from Macmillan Publishers Ltd: Nature Structural Biology 2001 8, 926–931. Copyright 2001.
Figure 12
Figure 12
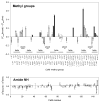
Response of the dynamics of calmodulin to binding of the smMLCKp domain. Top panel is for the side-chain methyl groups and the bottom is for the backbone NH groups. Secondary structure elements are indicated with solid lines. Methionines are highlighted in solid black. Adapted from Lee et al (2000). Reprinted by permission from Macmillan Publishers Ltd: Nature Structural Biology 2000 7, 72–77. Copyright 2000.
Figure 13
Figure 13
Examples of perturbation of methyl-bearing side chain dynamics due to the binding of ligands. Ligands are shown in dark green, protein backbones in white and methyl carbons as balls that are colored to reflect the change in ΔOaxis2 parameter between the uncomplexed and complexed states. Blues represent sites that are more rigid in the complex and reds are sites that are more mobile. A) Calmodulin in complex with the smMLCK peptide (based on PDB code 1CDL). B) PLCC SH2 in complex with the Y281 peptide (based on PDB code 1D4Z) C) CdcHs42 in complex with PDB42 and GDPPCP (based on PDB code 1EES). D) Phospholipase Cγ1 SH2 domain in complex with the pY1021 PDGFR peptide (based on PDB code 2PLE). Note the clustering of methyl groups near ligand binding sites that become more rigid upon binding and the propensity for methyl groups with increased amplitude of motion at solvent exposed sites distant from the ligand binding site. Prepared with MolMol.
Figure 14
Figure 14
Comparison between dynamically linked residues in a PDZ domain and thermodynamic couplings predicted from a family of PDZ domains. A) A summary of residues whose dynamical parameters changes significantly upon peptide-binding mapped onto the structure of the PDZ2:RA-GEF2 complex. The PDZ2 protein secondary structure is colored gray while the peptide ligand is green. Red VDW surfaces are side-chain methyl residues that had appreciable ΔOaxis2, in yellow are those methyl residues with appreciable Δτ, and in blue are backbone NHs that displayed changes in motion on the chemical shift time scale. Methyl groups not having changes in dynamics parameters are represented as gray VDW surfaces. Residues that were not compared are shown in black. For clarity, three views are presented. Residues of importance are labeled. B) The statistical couplings derived from Lockless and Ranganathan are mapped onto PDZ1:RA-DEF2 structure shown in identical views as in A. C) Primary sequences of four PDZ domains and color coded as in A. See Fuentes et al for more detail. Reprinted from the Journal of Molecular Biology 335, Fuentes, E. J., Der, C. J., Lee, A. L., Ligand-dependent dynamics and intramolecular signaling in a PDZ domain, pages 1105–15. Copyright (2004), with permission from Elsevier.
Figure 15
Figure 15
Parametric relationship between the generalized order parameter, reported by a nuclear interaction vector situated as a spy on an azimuthally symmetric harmonic oscillator, and the corresponding entropy. Here a simple quadratic potential is used and a parametric relationship between the entropy of the oscillator (inset) and the O2 parameter created by varying the force constant of governing the potential energy. Uncertainty in the reduced mass, depth of the energy well and effective length of the oscillator reduce the utility of the method for obtaining absolute entropies. However estimates of differences in entropy are anticipated to be at least semi-quantitative (see text).

References

    1. Englander SW, Kallenbach NR. Q Rev Biophys. 1983;16:521. - PubMed
    1. Weber G. Adv Prot Chem. 1975;29:1. - PubMed
    1. Gurd FR, Rothgeb TM. Adv Prot Chem. 1979;33:73. - PubMed
    1. Frauenfelder H, Parak F, Young RD. Ann Rev Biophys Biophys Chem. 1988;17:451. - PubMed
    1. Frauenfelder H, Sligar SG, Wolynes PG. Science. 1991;254:1598. - PubMed

Publication types