. 2006;7(5):R39.
doi: 10.1186/gb-2006-7-5-r39. Epub 2006 May 9.

Influence of metabolic network structure and function on enzyme evolution

Affiliations

Influence of metabolic network structure and function on enzyme evolution

Dennis Vitkup et al. Genome Biol. 2006.

Abstract

Background: Most studies of molecular evolution are focused on individual genes and proteins. However, understanding the design principles and evolutionary properties of molecular networks requires a system-wide perspective. In the present work we connect molecular evolution on the gene level with system properties of a cellular metabolic network. In contrast to protein interaction networks, where several previous studies investigated the molecular evolution of proteins, metabolic networks have a relatively well-defined global function. The ability to consider fluxes in a metabolic network allows us to relate the functional role of each enzyme in a network to its rate of evolution.

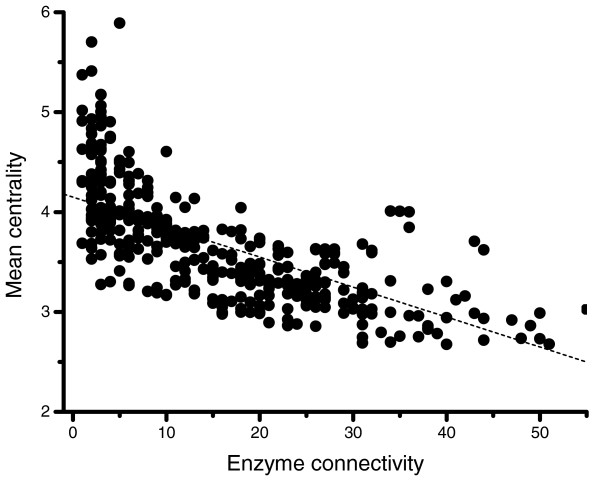
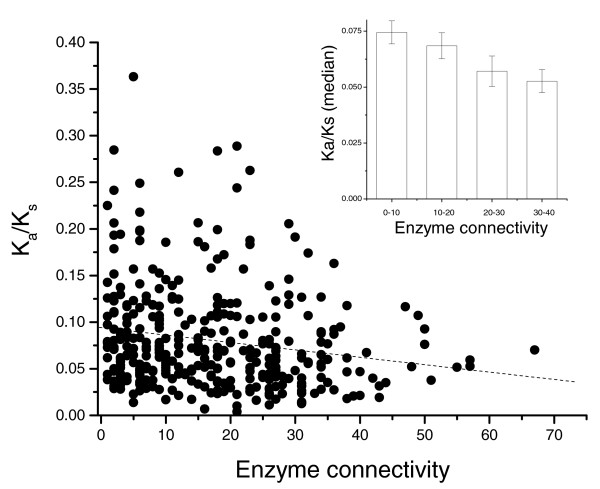
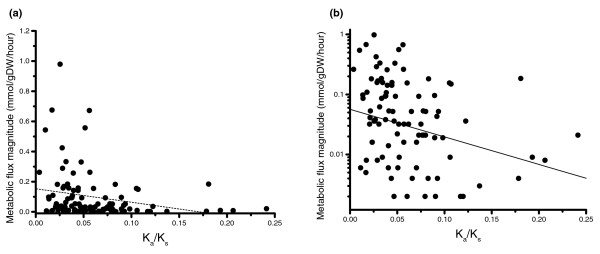
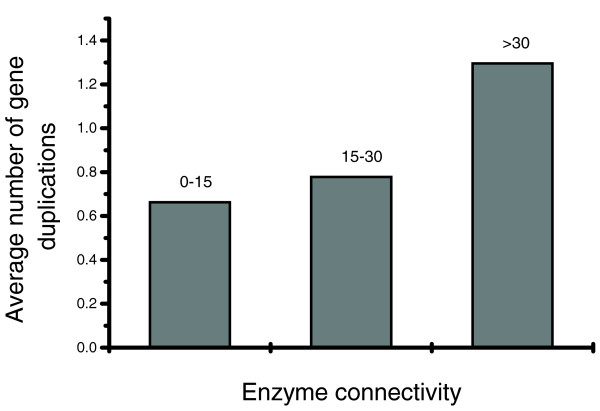
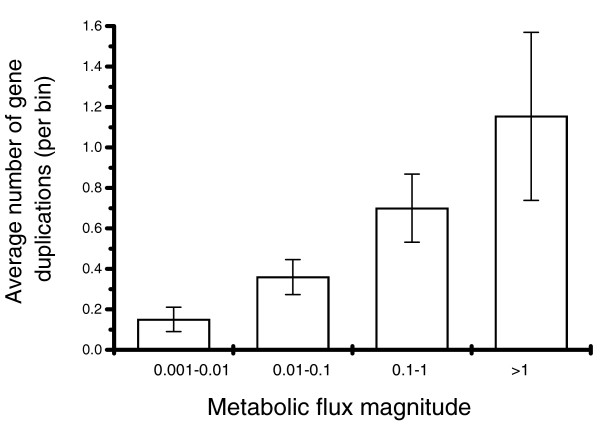
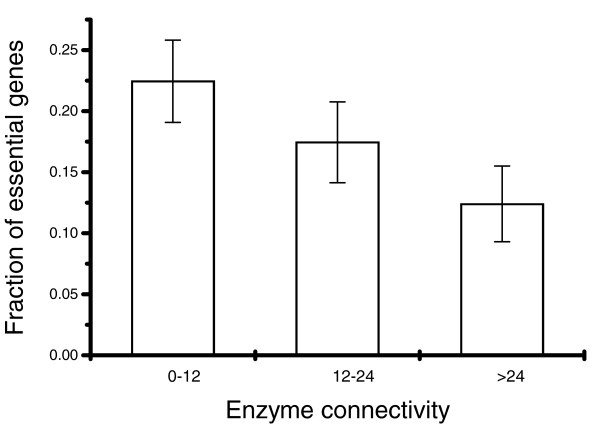
Results: Our results, based on the yeast metabolic network, demonstrate that important evolutionary processes, such as the fixation of single nucleotide mutations, gene duplications, and gene deletions, are influenced by the structure and function of the network. Specifically, central and highly connected enzymes evolve more slowly than less connected enzymes. Also, enzymes carrying high metabolic fluxes under natural biological conditions experience higher evolutionary constraints. Genes encoding enzymes with high connectivity and high metabolic flux have higher chances to retain duplicates in evolution. In contrast to protein interaction networks, highly connected enzymes are no more likely to be essential compared to less connected enzymes.

Conclusion: The presented analysis of evolutionary constraints, gene duplication, and essentiality demonstrates that the structure and function of a metabolic network shapes the evolution of its enzymes. Our results underscore the need for systems-based approaches in studies of molecular evolution.


Figures

Figure 1
Figure 1
The correlation between enzyme connectivity and centrality in the yeast metabolic network. Spearman's rank correlation r = -0.74, P < 0.0001; Pearson's correlation r = -0.67, P < 0.0001. The centrality of an enzyme is equal to the mean length of network distances from the enzyme to all other enzymes in the networks (pairs of enzymes not connected by any path in the network were excluded from the calculation).
Figure 2
Figure 2
The relationship between enzyme connectivity in the yeast metabolic network and evolutionary constraint quantified by the Ka/Ks ratio. Spearman's rank correlation r = -0.20, P = 1.1 × 10⁻⁴; Pearson's correlation r = -0.18, P = 7 × 10⁻⁴. The connectivity of a metabolic enzyme is equal to the total number of other network enzymes producing or consuming the enzyme's reactants and products. Ka is the fraction of amino acid replacement substitutions per amino acid replacement site on DNA; Ks is the fraction of silent substitutions per silent site on DNA. The inset shows the histogram of binned enzyme connectivity versus median evolutionary constraint Ka/Ks (using the same data as in the main figure). The standard errors in each bin are also shown.
Figure 3
Figure 3
The relationship between metabolic flux and evolutionary constraint.(a) The relationship between metabolic flux values and evolutionary constraint Ka/Ks for aerobic growth on glucose. (maximal uptake rate for glucose 15.3 mmol/g dry weight (DW)/h; maximal oxygen uptake 0.2 mmol/gDW/h). Spearman's rank correlation r = -0.30; P = 2.7 × 10⁻³; Pearson's correlation r = -0.24, P = 1.7 × 10⁻². The metabolic fluxes were calculated using flux balance analysis to maximize the cell growth rate. Fluxes more than two orders of magnitude larger than the median non-zero flux - representing large glycolytic fluxes - were excluded from the analysis. (b) The same as (a) but using log coordinates for the metabolic flux magnitude.
Figure 4
Figure 4
The relationship between enzyme connectivity and the average number of duplications in corresponding enzyme-coding genes. Enzymes with sequence identity larger than 40% over 100 or more aligned amino acids were considered as duplicates.
Figure 5
Figure 5
The relationship between the number of duplicates of an enzyme-coding gene and the magnitude of the metabolic flux through the enzymatic reaction. The results are shown for aerobic growth on glucose (maximal uptake rate for glucose 15.3 mmol/gDW/h; oxygen 0.2 mmol/gDW/h). Putative duplicate pairs with less than 40% amino acid similarity or less than 100 aligned amino acid residues were excluded.
Figure 6
Figure 6
The relationship between enzyme connectivity and gene essentiality. The connectivity of a metabolic enzyme is equal to the total number of other network enzymes producing or consuming the enzyme's reactants and products. The information on gene essentiality was obtained from the systematic gene deletion study by Giaever et al. [23] using the SGD database [25].

Comment in

References

    1. Jeong H, Mason SP, Barabasi AL, Oltvai ZN. Lethality and centrality in protein networks. Nature. 2001;411:41–42. doi: 10.1038/35075138. - DOI - PubMed
    1. Hirsh AE, Fraser HB. Protein dispensability and rate of evolution. Nature. 2001;411:1046–1049. doi: 10.1038/35082561. - DOI - PubMed
    1. Pal C, Papp B, Hurst LD. Highly expressed genes in yeast evolve slowly. Genetics. 2001;158:927–931. - PMC - PubMed
    1. Fraser HB, Hirsh AE, Steinmetz LM, Scharfe C, Feldman MW. Evolutionary rate in the protein interaction network. Science. 2002;296:750–752. doi: 10.1126/science.1068696. - DOI - PubMed
    1. Jordan IK, Wolf DM, Koonin EV. No simple dependence between protein evolution rate and the number of protein-protein interactions: only the most prolific interactors tend to evolve slowly. BMC Evol Biol. 2003;3:1–12. doi: 10.1186/1471-2148-3-1. - DOI - PMC - PubMed

LinkOut - more resources