. 2006 Jun;78(6):903-13.
doi: 10.1086/503876. Epub 2006 Apr 7.

Multilocus association mapping using variable-length Markov chains

Affiliations

Multilocus association mapping using variable-length Markov chains

Sharon R Browning. Am J Hum Genet. 2006 Jun.

Abstract

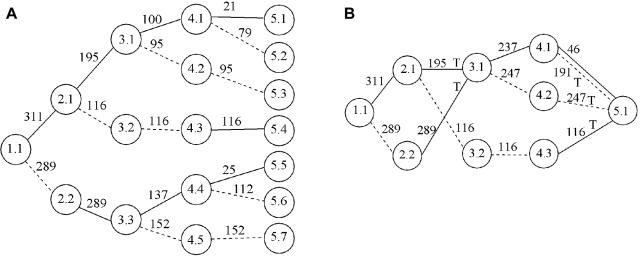
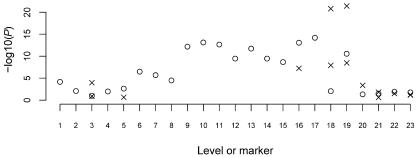
I propose a new method for association-based gene mapping that makes powerful use of multilocus data, is computationally efficient, and is straightforward to apply over large genomic regions. The approach is based on the fitting of variable-length Markov chain models, which automatically adapt to the degree of linkage disequilibrium (LD) between markers to create a parsimonious model for the LD structure. Edges of the fitted graph are tested for association with trait status. This approach can be thought of as haplotype testing with sophisticated windowing that accounts for extent of LD to reduce degrees of freedom and number of tests while maximizing information. I present analyses of two published data sets that show that this approach can have better power than single-marker tests or sliding-window haplotypic tests.


Figures

Figure  1
Figure 1
VLMC model for a region containing three haplotype blocks. Solid arrows represent SNP allele 1; dashed arrows represent SNP allele 2. Edges to be tested are marked “T.”
Figure  2
Figure 2
A, Tree graph constructed using the haplotype data in table 1. Circles represent nodes, and the values in them represent level and node identifier within level; for example, “3.2” denotes node 2 at level 3. A solid edge between nodes at levels i and i+1 represents allele 1 at SNP marker i; a dashed edge represents allele 2. Numbers above edges represent haplotype counts. Thus, 137 over the edge between 3.3 and 4.4 represents 137 haplotypes that have allele 2 at the first SNP, 1 at the second SNP, and 1 at the third SNP. Although directional arrows are not shown, a left-to-right direction is implied. B, The graph from figure 2A after merging. Nodes 3.1 and 3.3 in figure 2A have been merged, as have all nodes at level 5. Notation is as described for panel A. Edges to be tested are marked with “T.”
Figure  3
Figure 3
Model fitted to the cystic fibrosis region-coded data. Each of the various line patterns represents an allele code (alleles A–H25). The nodes are shown as circles, with area proportional to the total count for the node.
Figure  4
Figure 4
P values for tests of association between the region markers and cystic fibrosis: Fisher’s exact single-marker allelic test P values (○); graph-edge test P values (×).
Figure  5
Figure 5
Model fitted to the cystic fibrosis RFLP data. Solid lines represent allele 1; dashed lines represent allele 2. The nodes are shown as circles, with area proportional to the total count for the node.
Figure  6
Figure 6
P values for tests of association between the RFLP markers and cystic fibrosis: Fisher’s exact single marker allelic test P values (○); graph-edge test P values (×).
Figure  7
Figure 7
P values for tests of association between the genetic markers and Crohn disease: Fisher’s exact single marker test P values (○); graph-edge test P values from the model fit to markers 1–60 (+) and from the model fit to markers 44–103 (×).

References

Web Resources

    1. HapVLMC, http://www.stat.auckland.ac.nz/~browning/HapVLMC/index.htm (for R code for implementing the proposed method)
    1. Online Mendelian Inheritance in Man (OMIM), http://www.ncbi.nlm.nih.gov/Omim/ (for cystic fibrosis and Crohn disease)

References

    1. Clark AG (2004) The role of haplotypes in candidate gene studies. Genet Epidemiol 27:321–33310.1002/gepi.20025 - DOI - PubMed
    1. Schaid DJ (2004) Evaluating associations of haplotypes with traits. Genet Epidemiol 27:348–36410.1002/gepi.20037 - DOI - PubMed
    1. Akey J, Jin L, Xiong M (2001) Haplotypes vs single marker linkage disequilibrium tests: what do we gain? Eur J Hum Genet 9:291–30010.1038/sj.ejhg.5200619 - DOI - PubMed
    1. Excoffier L, Slatkin M (1995) Maximum-likelihood estimation of molecular haplotype frequencies in a diploid population. Mol Biol Evol 12:921–927 - PubMed
    1. Zhao JH, Curtis D, Sham PC (2000) Model-free analysis and permutation tests for allelic associations. Hum Hered 50:133–13910.1159/000022901 - DOI - PubMed

Substances