. 2006;7(5):R36.
doi: 10.1186/gb-2006-7-5-r36. Epub 2006 May 10.

The Inferelator: an algorithm for learning parsimonious regulatory networks from systems-biology data sets de novo

Affiliations

The Inferelator: an algorithm for learning parsimonious regulatory networks from systems-biology data sets de novo

Richard Bonneau et al. Genome Biol. 2006.

Abstract

We present a method (the Inferelator) for deriving genome-wide transcriptional regulatory interactions, and apply the method to predict a large portion of the regulatory network of the archaeon Halobacterium NRC-1. The Inferelator uses regression and variable selection to identify transcriptional influences on genes based on the integration of genome annotation and expression data. The learned network successfully predicted Halobacterium's global expression under novel perturbations with predictive power similar to that seen over training data. Several specific regulatory predictions were experimentally tested and verified.


Figures
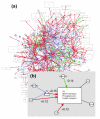
Figure 1
Figure 1
The inferred regulatory network of Halobacterium NRC-1, visualized using Cytoscape and Gaggle. (a) The full inferred regulatory network. Regulators are indicated as circles, with black undirected edges to biclusters (rectangles) that they are members of. Green and red arrows represent repression (β < 0) and activation (β > 0) edges, respectively. The thickness of regulation edges is proportional to the strength of the edge as determined by the Inferelator (β for that edge). Interactions are shown as triangles connected to regulators by blue edges. Weak influences (|β| < 0.1) are not shown. (b) Example regulation of Bicluster 76. The four transcription factors (TFs) sirR, kaiC, VNG1405C, and VNG2476C were selected by the Inferelator as the most likely regulators of the genes in bicluster 76 from the set of all (82) candidate regulators. The relative weights, β, by which the regulators are predicted to combine to determine the level of expression of the genes of bicluster 76, are indicated alongside each regulation edge. The TFs VNG2476C and kaiC combine in a logical AND relationship. phoU and prp1 are TFs belonging to bicluster 76.
Figure 2
Figure 2
Predictive power of inferred network on biclusters. (a) The root mean square deviation (RMSD) error of predicted response in comparison with the true response for the 300 predicted biclusters evaluated over the 268 conditions of the training set. (b) The RMSD error of the same 300 biclusters evaluated on new data (24 conditions) collected after model fitting/network construction.
Figure 3
Figure 3
Predictive power on genes with unique expression profiles. Histograms of root mean square deviation (RMSD) of predicted response versus measured response, as calculated in Figure 2. (a) The RMSD error of predicted to true response for the 159 genes that cMonkey identified as having unique expression patterns and were therefore not included in any bicluster. (b) The same error over new data collected after model fitting/network construction for these 159 isolates.
Figure 4
Figure 4
Core process regulation/homeostasis, including diverse transport process, by trh3, trh4, trh5, trh7, tbpD, and kaiC. Biclusters (rectangles with height proportional to the number of genes in the bicluster and width proportional to the number of conditions included in the bicluster) are colored by function, as indicated in the legend. In cases where multiple functions are present in a single bicluster the most highly represented functions are listed.
Figure 5
Figure 5
Predictive performance on biclusters representing key processes. Each plot shows a bicluster with a dominant functional theme from Figure 4. The red line indicates the measured expression profile, and the blue line shows the profile as predicted by the network model. Conditions in the left-most region of each plot were included in the bicluster, the middle regions show conditions excluded from the bicluster, and the right-most region of each plot corresponds to the 24 measurements that were not part of the original data set. The two right-most regions of each plot, therefore, demonstrate predictive power over conditions not in the training set. The estimation model parameters was done using only left-most/green conditions.
Figure 6
Figure 6
Measured and predicted response for transport processes (bicluster 76). Red shows the measured response of bicluster 76 over 277 conditions (mRNA expression levels measured as described under Materials and methods, in the text). Bicluster 76 represents transport processes controlled by the regulators KaiC and SirR (Figure 1b). Blue shows the value predicted by the regulator influence network. Conditions in (a) correspond to conditions included in bicluster 76 (conditions for which these genes have high variance and are coherent). (b) Shows conditions out of the bicluster but in the original/training data set. (These regions were not used to fit the model for bicluster 76, because models were fit only over bicluster conditions.) (c) Contains conditions/measurements that were not part of the original data set and thus were not present when the biclustering and subsequent network inference/model fitting procedures were carried out. Regions B and C demonstrate out of sample predictive power.
Figure 7
Figure 7
Graphical depiction of three possible interactions between predictor terms X1 and X2 (AND, OR, and XOR) that can be encoded by the design matrix Z. Values of β· Z range from 0 (red) to 1 (white). The interactions are encoded by specific linear combinations of X1, X2 and min(X1, X2), using the coefficients (three elements in the vector β) for the individual components (Table 2).
Figure 8
Figure 8
Selection of model for bicluster using cross-validation (CV). The ordinate represents an estimate of prediction error (ErrCV) from tenfold CV (the mean of the error in the 10 leave-out samples used is the CV error estimate). The shrinkage parameter t allows us to select subsets of predictors continuously. We evaluate our fitted model for a range of values of t (with t = 0 [the null model] and t = 1 [the ordinary least squares solution]). The error bars denote the standard error of ErrCV (the standard deviation of the 10 leave-out samples' error estimates). The red line shows the value of t selected for our final model for this cluster - the most parsimonious model within 1 standard error of the minimum on the ErrCV versus t curve.

Similar articles

Cited by

References

    1. Herrgard MJ, Covert MW, Palsson BO. Reconstruction of microbial transcriptional regulatory networks. Curr Opin Biotechnol. 2004;15:70–77. - PubMed
    1. De Jong H. Modeling and simulation of genetic regulatory systems: a literature review. J Comput Biol. 2002;9:67–103. - PubMed
    1. Alm E, Arkin AP. Biological networks. Curr Opin Struct Biol. 2003;13:193–202. - PubMed
    1. Hashimoto RF, Kim S, Shmulevich I, Zhang W, Bittner ML, Dougherty ER. Growing genetic regulatory networks from seed genes. Bioinformatics. 2004;20:1241–1247. - PubMed
    1. Shmulevich I, Kauffman SA. Activities and sensitivities in Boolean network models. Phys Rev Lett. 2004;93:048701. - PMC - PubMed

Publication types

MeSH terms

LinkOut - more resources