. 2006 May 10;26(19):5117-30.
doi: 10.1523/JNEUROSCI.0319-06.2006.

Depolarizing GABAergic conductances regulate the balance of excitation to inhibition in the developing retinotectal circuit in vivo

Affiliations

Depolarizing GABAergic conductances regulate the balance of excitation to inhibition in the developing retinotectal circuit in vivo

Colin J Akerman et al. J Neurosci. .

Abstract

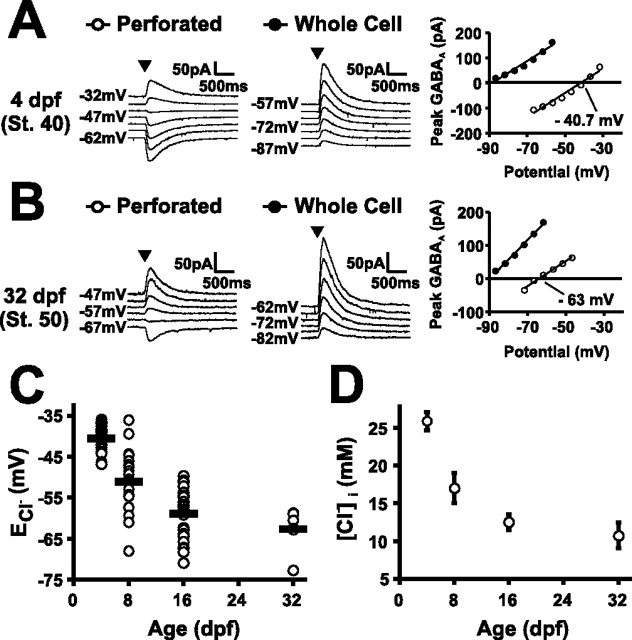
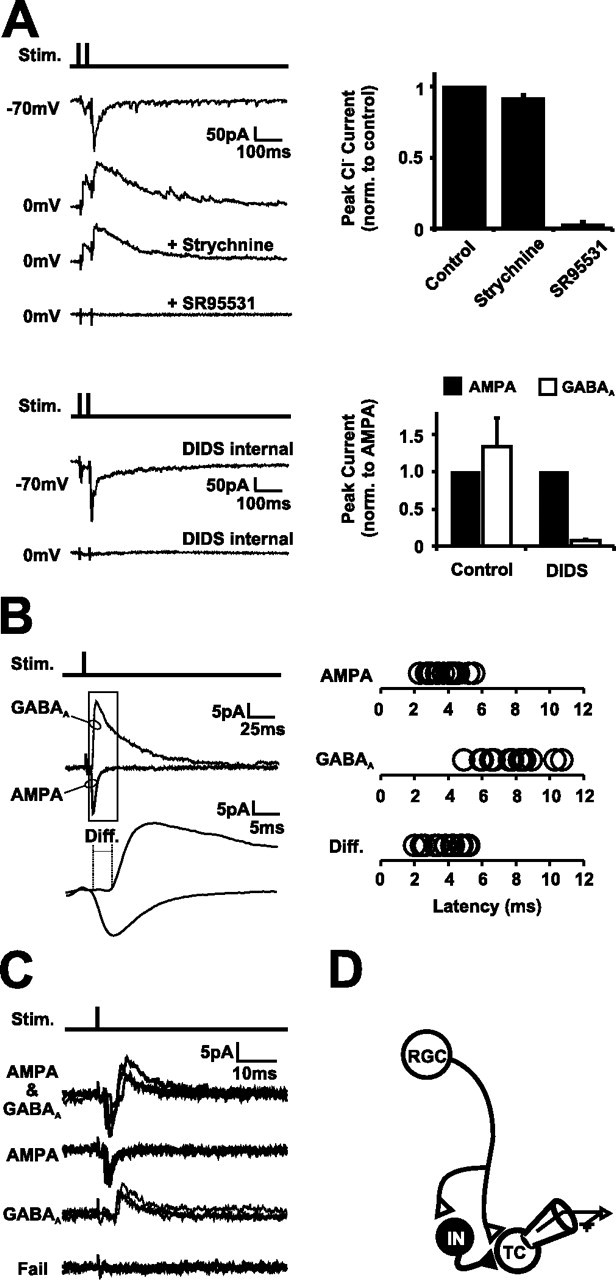
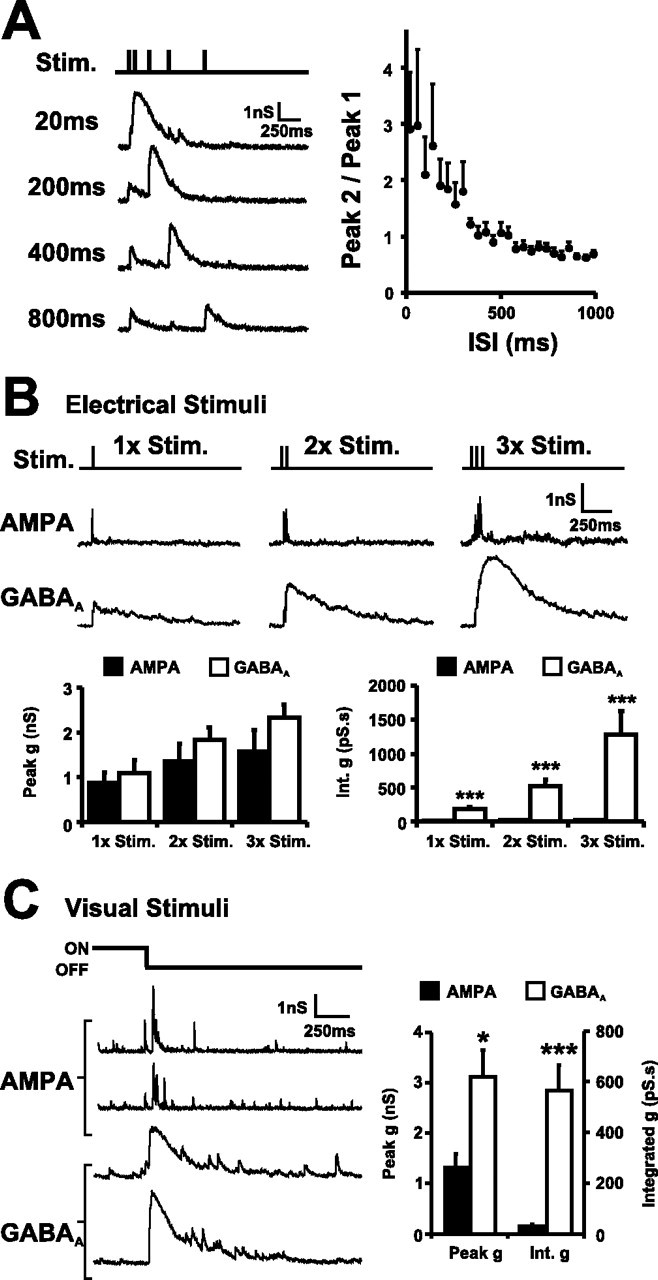
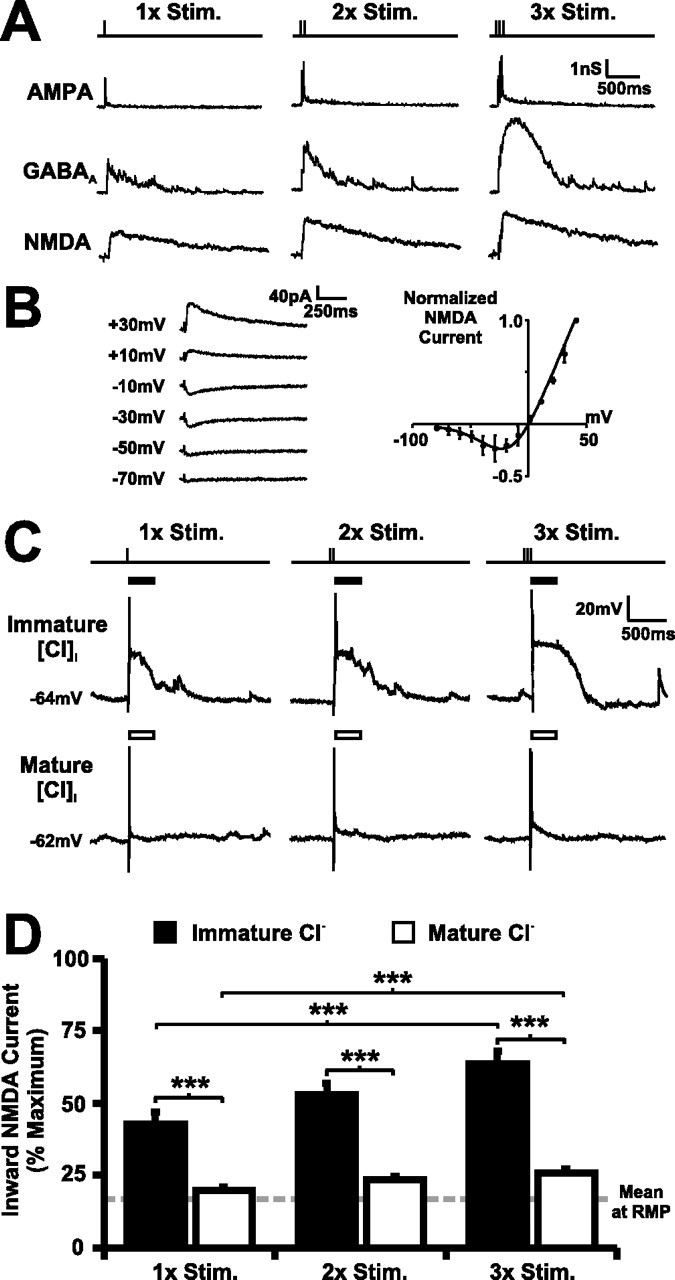
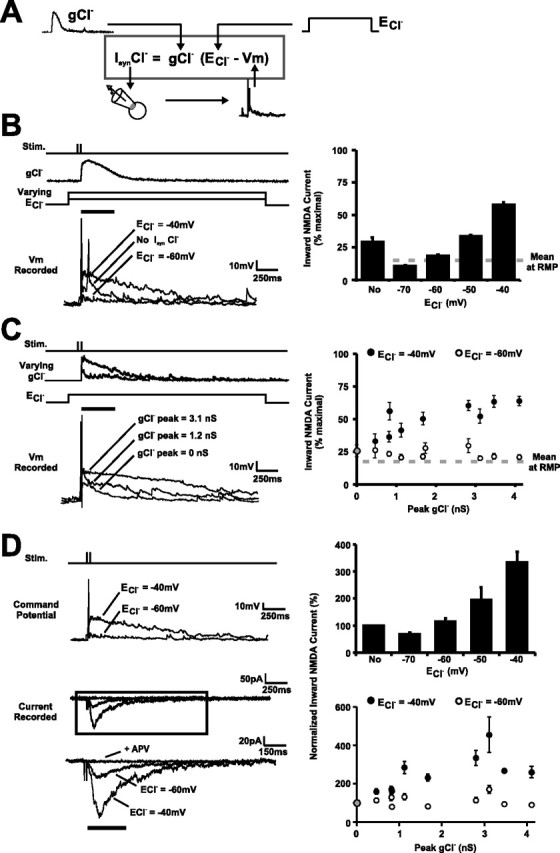
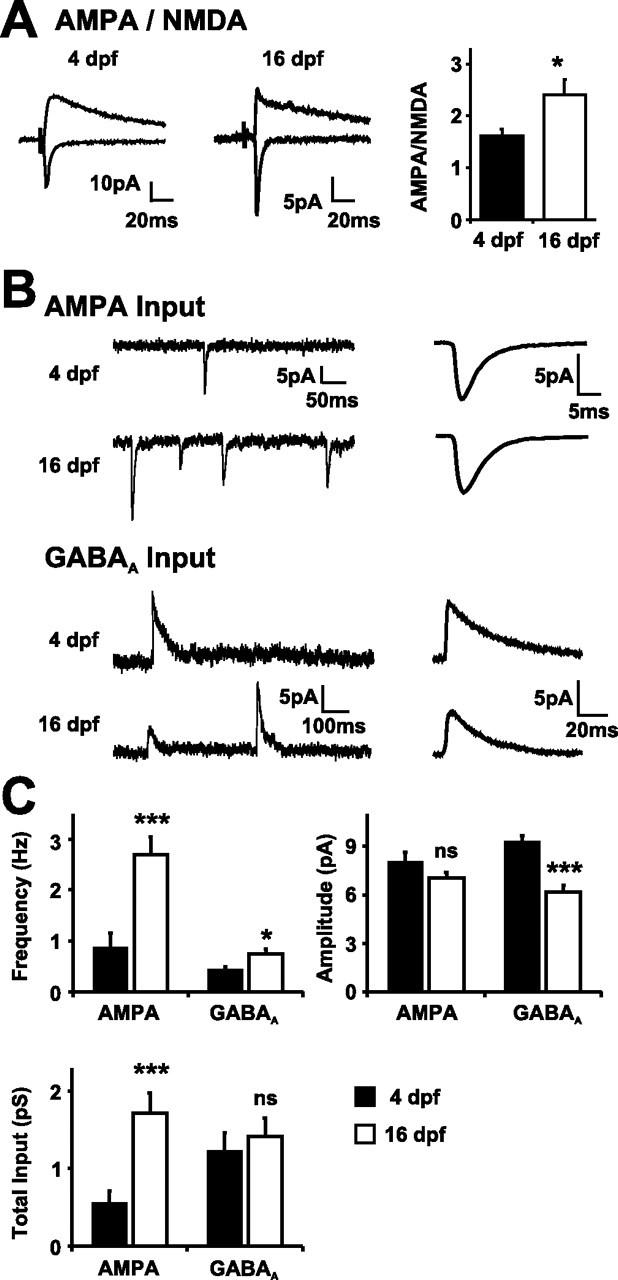
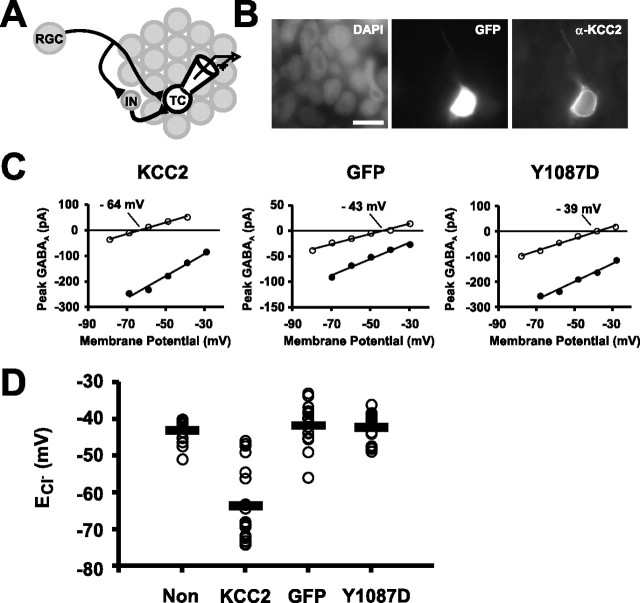
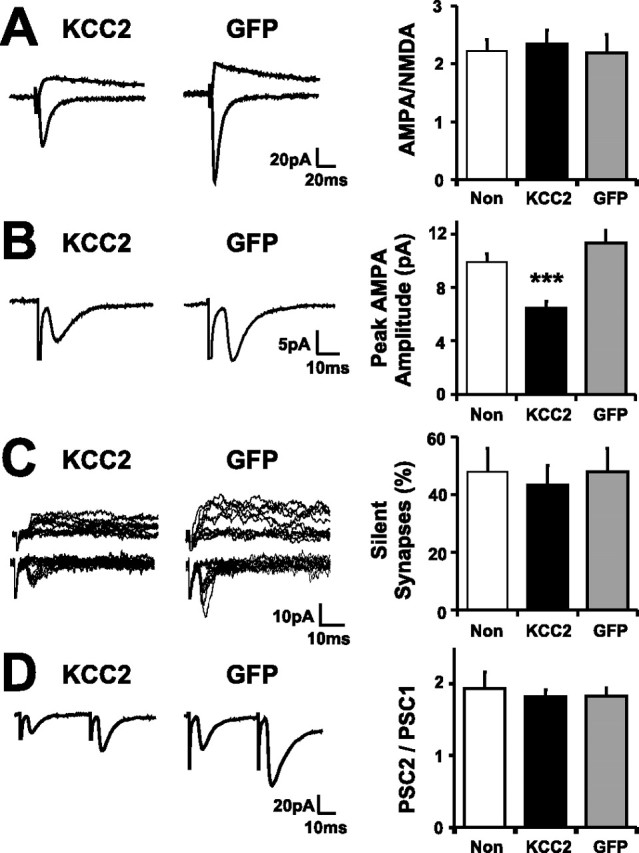
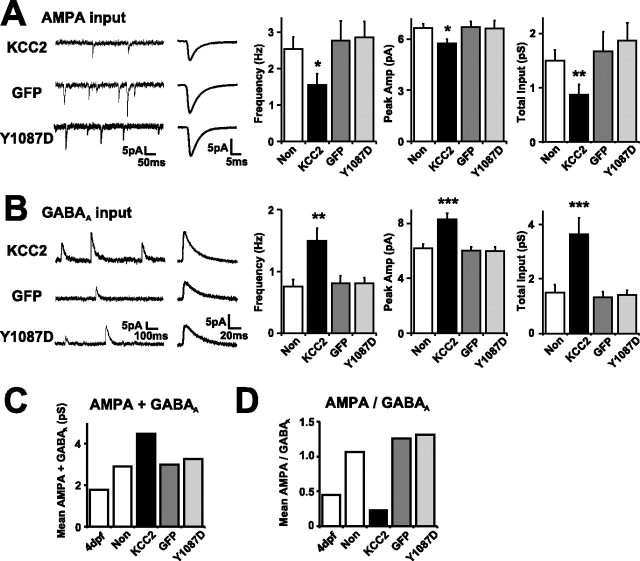
Neurotransmission during development regulates synaptic maturation in neural circuits, but the contribution of different neurotransmitter systems is unclear. We investigated the role of GABAA receptor-mediated Cl- conductances in the development of synaptic responses in the Xenopus visual system. Intracellular Cl- concentration ([Cl-]i) was found to be high in immature tectal neurons and then falls over a period of several weeks. GABAergic synapses are present at early stages of tectal development and, when activated by optic nerve stimulation or visual stimuli, induce sustained depolarizing Cl- conductances that facilitate retinotectal transmission by NMDA receptors. To test whether depolarizing GABAergic inputs cooperate with NMDA receptors during activity-dependent maturation of glutamatergic synapses, we prematurely reduced [Cl-]i in tectal neurons in vivo by expressing the Cl- transporter KCC2. This blocked the normal developmental increase in AMPA receptor-mediated retinotectal transmission and increased GABAergic synaptic input to tectal neurons. Therefore, depolarizing GABAergic transmission plays a pivotal role in the maturation of excitatory transmission and controls the balance of excitation and inhibition in the developing retinotectal circuit.


Figures

Figure 1.
Figure 1.
Xenopus tectal neurons show a developmental shift in [Cl]i. Gramicidin perforated patch voltage-clamp recordings were performed on tectal neurons at different developmental stages. Currents were evoked by focal application of the GABAA agonist muscimol (arrowheads) and the membrane was clamped at different command potentials (−100 to 0 mV). Having recorded the ECl− of the cell in perforated mode (open symbols), the integrity of the perforated patch was confirmed by breaking into whole-cell mode and monitoring a decrease in the ECl− caused by dialysis of a low Cl intracellular recording solution (filled symbols). ECl− was defined as the x-intercept value of the muscimol-induced peak current. Representative recordings are shown from a tadpole at 4 dpf corresponding to stage 40 (A) and a tadpole at 32 dpf corresponding to stage 50 (B). Population data show the developmental shift in ECl− (C) and the [Cl]i (D) across four different ages: 4 dpf (stage 40; n = 29 cells), 8 dpf (stage 47; n = 22 cells), 16 dpf (stage 48/49; n = 30 cells), and 32 dpf (stage 50/51; n = 6 cells). Bars indicate SEM. ECl− decreased between 4 and 32 dpf with the major shift occurring between 4 and 16 dpf (p < 0.001).
Figure 2.
Figure 2.
Retinal activity drives a feedforward GABAergic circuit. A, Retinotectal synaptic responses were evoked by stimulation of RGC axons in the optic chiasm. SR95531, a GABAAR antagonist, blocked the synaptically evoked Cl currents (n = 6 cells), but strychnine, a glycine receptor antagonist, did not. The Cl conductance was also blocked by intracellular dialysis of a recording solution containing DIDS (n = 12 and 10 cells for control and DIDS solutions, respectively). The stimulus artifact in the example traces and, in the following examples, has been truncated for clarity. B, GABAA synaptic currents evoked by retinal afferent stimulation are delayed compared with AMPA currents. A single stimulus to the optic chiasm evoked a monosynaptic AMPA response (Vh of −70 mV) that was followed by a delayed GABAA response (Vh of 0 mV) in the same tectal neuron (n = 15 cells). C, Minimal stimulation of the optic chiasm while recording tectal cell responses at an intermediate command potential (Vh of −40 mV) evoked AMPA–GABAA sequences as well as trials in which the AMPA, the GABAA, or both components of the response failed (n = 8 cells). D, These data are consistent with the existence of a disynaptic feedforward GABAergic circuit at these early stages of retinotectal development (4 dpf). Retinal afferents (RGC) provide direct monosynaptic glutamatergic input to tectal cells (TC), and GABAergic interneurons (IN) within this population of cells provide a source of feedforward GABAergic input.
Figure 3.
Figure 3.
GABAergic inputs are recruited by retinal afferent activity. A, GABAergic activity was substantially enhanced in response to stimuli delivered in close succession. GABAA conductances (Vh of 0 mV) were evoked by pairs of optic nerve stimuli delivered at different intervals (ISI of 20, 200, 400, and 800 ms; n = 12 cells). B, The integrated conductance for GABAA synaptic responses evoked by trains of afferent stimulation (1–3 stimuli, 50 Hz) was substantially larger than AMPA responses in the same neuron, although peak conductances were comparable. AMPA (Vh of −70 mV) and GABAA (Vh of 0 mV) responses are displayed as conductances (n = 9 cells). C, Visual stimuli recruit substantial GABAergic activity in stage 40 tadpoles. In vivo recordings show that OFF visual stimuli produce fast AMPA conductances and sustained GABAA conductances in tectal cells comparable with those evoked by short bursts of electrical stimuli to the RGC afferents (n = 16 cells). Error bars indicate SEM. ∗p < 0.05; ∗∗∗p < 0.001 for this and all subsequent figures.
Figure 4.
Figure 4.
Cl conductances are well placed to modulate NMDAR transmission in the immature retinotectal circuit. A, Isolated AMPA, GABAA, and NMDA synaptic conductances in a 4 dpf tectal neuron shown for one, two, and three stimuli trains delivered to the optic chiasm (50 Hz). The sustained GABAA conductance has a temporal profile similar to the NMDA conductance. B, Synaptically evoked NMDA responses in 4 dpf tectal neurons (n = 11 cells) show classic voltage-dependent block by extracellular Mg2+, and the relationship between NMDA current and membrane potential can be described by an exponential function (see Materials and Methods). C, Voltage traces from two neighboring 4 dpf tectal cells after imposing a mature (bottom) or immature (top) [Cl]i by dialysis of different intracellular recording solutions. Inward NMDAR current was estimated from the voltage waveforms over a 250 ms window after stimulation (bars). D, The 4 dpf cells that had an immature [Cl]i imposed (n = 13 cells) showed large NMDA currents that approached the maximal inward NMDA current. In contrast, 4 dpf cells that had a mature [Cl]i imposed (n = 14 cells) showed small inward NMDA currents that were close to those measured at RMP (14.6% of maximal inward NMDA current). The difference between immature and mature [Cl]i was highly significant (∗∗p < 0.001), with the increase in NMDA unblock over rest being fivefold greater in cells with immature [Cl]i than in cells with mature [Cl]i. Error bars indicate SEM. ∗∗∗p < 0.001.
Figure 5.
Figure 5.
Developmental shifts in [Cl]i impact NMDAR transmission in the retinotectal circuit. A, Synaptic Cl currents (IsynCl) were simulated using dynamic clamp and paired with responses evoked by RGC afferent stimulation. Waveforms for gCl were taken from real GABAA conductances (see Fig. 3B). B, Voltage traces (left) from a 4 dpf tectal cell showing responses to RGC afferent stimulation (2 stimuli, 50 Hz) paired with no IsynCl, a dynamic IsynCl with an ECl− of −40 mV, or a dynamic IsynCl with an ECl− of −60 mV. The waveform for gCl was the median GABAA conductance, after ranking by peak amplitude (Fig. 3B). Summary graph (right) shows estimated NMDA inward current in response to RGC afferent stimulation paired with a dynamic IsynCl with different ECl− values (−70, −60, −50, and −40 mV) or no IsynCl (No). ECl− had a highly significant effect on inward NMDA current (p < 0.001; n = 18 cells). C, Voltage traces (left) from a 4 dpf tectal cell showing responses to RGC afferent stimulation combined with a dynamic IsynCl whose peak gCl was 0 nS (no IsynCl), 1.2 nS, or 3.1 nS. ECl− was −40 mV. Summary graph (right) shows the estimated inward NMDA current after paired RGC afferent stimulation and dynamic IsynCl with different peak gCl values (n = 14 cells). ECl− was −40 mV (immature) for filled symbols and −60 mV (mature) for open symbols. D, Measuring synaptic NMDA currents under Vm waveforms shaped by different IsynCl. NMDA currents in a 4 dpf tectal cell (left) were pharmacologically isolated (see Materials and Methods) and evoked by pairing RGC afferent stimulation (2 stimuli, 50 Hz) with different command potential waveforms derived from the dynamic-clamp experiments in B and C. The synaptically evoked current was blocked by APV, confirming that it was carried by NMDARs. Summary graphs (right) compare NMDA currents recorded under Vm waveforms in which peak gCl and ECl− had been systematically varied (n = 14 cells). Values are expressed as percentage of NMDA inward current recorded under Vm waveforms in which there had been no IsynCl (corresponding to “No” and 0 nS). Error bars indicate SEM.
Figure 6.
Figure 6.
Maturation of synaptic properties in the retinotectal system parallels the developmental shift in [Cl]i. A, AMPA/NMDA ratios increase between 4 and 16 dpf. Traces (averages of 50) showing glutamatergic currents recorded at +45 and −70 mV from a tectal cell at 4 dpf (left) and 16 dpf (right). The summary graph shows a significant increase in AMPA/NMDA ratio (p < 0.05). B, Total AMPA input to tectal cells increases between 4 and 16 dpf. Total GABAA input to tectal cells is consistent between 4 and 16 dpf. AMPA and GABAA sample recordings (left) and the aligned and averaged mPSC (right) recorded from representative 4 dpf (top) and 16 dpf (bottom) tectal cells are shown. C, Summary graphs of AMPA and GABAA mPSC frequency, amplitude, and total input compared at 4 dpf (filled bars) and 16 dpf (open bars). There was no statistical difference in the AMPA amplitude at the two ages (p = 0.16), but a dramatic increase in frequency generated a threefold increase in total AMPA input (∗∗∗p < 0.001; n = 31 and 42 cells at 4 and 16 dpf, respectively). There was a significant increase in GABAA mPSC frequency with age (∗p < 0.05) but a concomitant decrease in the amplitude (∗∗∗p < 0.001) such that the total GABAA input did not change over this window of development (p = 0.67; n = 29 and 47 cells at 4 and 16 dpf, respectively). Error bars indicate SEM. ns, Not significant.
Figure 7.
Figure 7.
Premature KCC2 overexpression shifts [Cl]i in developing tectal neurons. A, Experimental design showing that [Cl]i was manipulated in a small number of tectal cells (TC, white cell) that were part of an otherwise normal retinotectal circuit. IN, Interneuron. B, At 36–48 h after electroporation, KCC2 expression increased KCC2 protein levels in transfected tectal cells. DAPI, 4′,6′-Diamidino-2-phenylindole. Scale bar, 10 μm. C, Gramicidin recordings of the ECl− in a representative KCC2 cell (left), GFP cell (center), and Y1087D cell (right). Having recorded the ECl− of the cell in perforated mode (open symbols), the integrity of the perforated patch was confirmed by breaking into whole-cell mode and monitoring an increase in the ECl− caused by dialysis of a high Cl intracellular recording solution (filled symbols). D, Premature expression of KCC2 in vivo caused a robust shift in ECl− compared with GFP, Y1087D, and nontransfected (Non) control cells, consistent with a significant decrease in the [Cl]i (p < 0.001). The average ECl− in KCC2 cells was −63.6 ± 2.2 mV (n = 20 cells) compared with −41.7 ± 1.3 mV in GFP (n = 18 cells), −42.2 ± 1.0 mV in Y1087D cells (n = 16 cells), and −43.0 ± 0.9 mV in nontransfected neurons (n = 15 cells).
Figure 8.
Figure 8.
Low [Cl]i impairs the development of aspects of glutamatergic transmission in the retinotectal circuit in vivo. A, AMPA/NMDA ratios are comparable in KCC2 cells, GFP cells, and nontransfected cells (Non) (p = 0.9). Example traces are averages of 20–30 responses. B, The amplitude of AMPA-mediated retinotectal transmission under minimal stimulation conditions was highly significantly reduced in KCC2 cells compared with nontransfected or GFP cells (∗∗∗p < 0.001; n = 20, 25, and 17 cells, respectively). C, The fraction of synapses mediated solely by NMDARs (Silent Synapses) was comparable in KCC2 cells, nontransfected cells, and GFP cells (p = 0.87). D, Paired pulse facilitation, defined as the ratio of the peak evoked currents (PSC2/PSC1; 25 Hz), was comparable in KCC2, nontransfected, and GFP cells (p = 0.85; n = 19, 17, and 11 cells, respectively). Error bars indicate SEM.
Figure 9.
Figure 9.
Low [Cl]i impairs the developmental balance of glutamatergic and GABAergic synaptic inputs in the retinotectal circuit in vivo. A, Total AMPA input was significantly reduced in KCC2 cells (n = 42 cells) compared with nontransfected, GFP, and Y1087D cells (n = 49, 25, and 47 cells, respectively). Traces (left) show sample recordings and averaged AMPA mPSCs recorded from representative cells. Three graphs (right) show the decrease in frequency (∗p < 0.05), amplitude (∗p < 0.05), and total AMPA input (∗∗p < 0.005) in cells expressing KCC2. B, Total GABAA input to tectal cells was significantly increased in KCC2 cells (n = 31 cells) compared with nontransfected, GFP, and Y1087D cells (n = 39, 25, and 24 cells, respectively). Traces (left) show sample recordings and averaged GABAA mPSCs recorded from representative cells. Three graphs (right) show the increase in frequency (∗∗p < 0.005), amplitude (∗∗∗p < 0.001), and total GABAA input (∗∗∗p < 0.001) in cells expressing KCC2. Error bars indicate SEM. The overall input (total AMPA plus total GABAA; C) and the ratio of AMPA to GABAA inputs (total AMPA/total GABAA; D) were calculated from the population averages and compared with the values at 4 dpf. KCC2 cells exhibited the highest overall input but the lowest ratio of AMPA to GABAA inputs.

References

    1. Aamodt SM, Shi J, Colonnese MT, Veras W, Constantine-Paton M (2000). Chronic NMDA exposure accelerates development of GABAergic inhibition in the superior colliculus. J Neurophysiol 83:1580–1591. - PubMed
    1. Aizenman CD, Akerman CJ, Jensen KR, Cline HT (2003). Visually driven regulation of intrinsic neuronal excitability improves stimulus detection in vivo. Neuron 39:831–842. - PubMed
    1. Artola A, Brocher S, Singer W (1990). Different voltage-dependent thresholds for inducing long-term depression and long-term potentiation in slices of rat visual cortex. Nature 347:69–72. - PubMed
    1. Ascher P, Nowak L (1988). The role of divalent cations in the N-methyl-d-aspartate responses of mouse central neurones in culture. J Physiol (Lond) 399:247–266. - PMC - PubMed
    1. Ben-Ari Y (2002). Excitatory actions of GABA during development: the nature of the nurture. Nat Rev Neurosci 3:728–739. - PubMed

Publication types

MeSH terms