

Parkinson's disease brain mitochondrial complex I has oxidatively damaged subunits and is functionally impaired and misassembled
- PMID: 16687518
- PMCID: PMC6674236
- DOI: 10.1523/JNEUROSCI.0984-06.2006
Parkinson's disease brain mitochondrial complex I has oxidatively damaged subunits and is functionally impaired and misassembled
Abstract
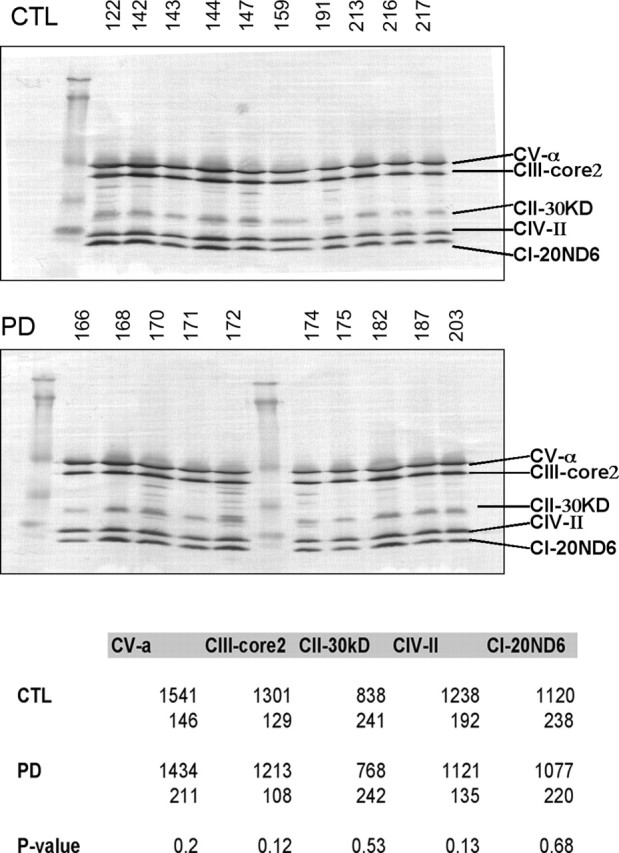
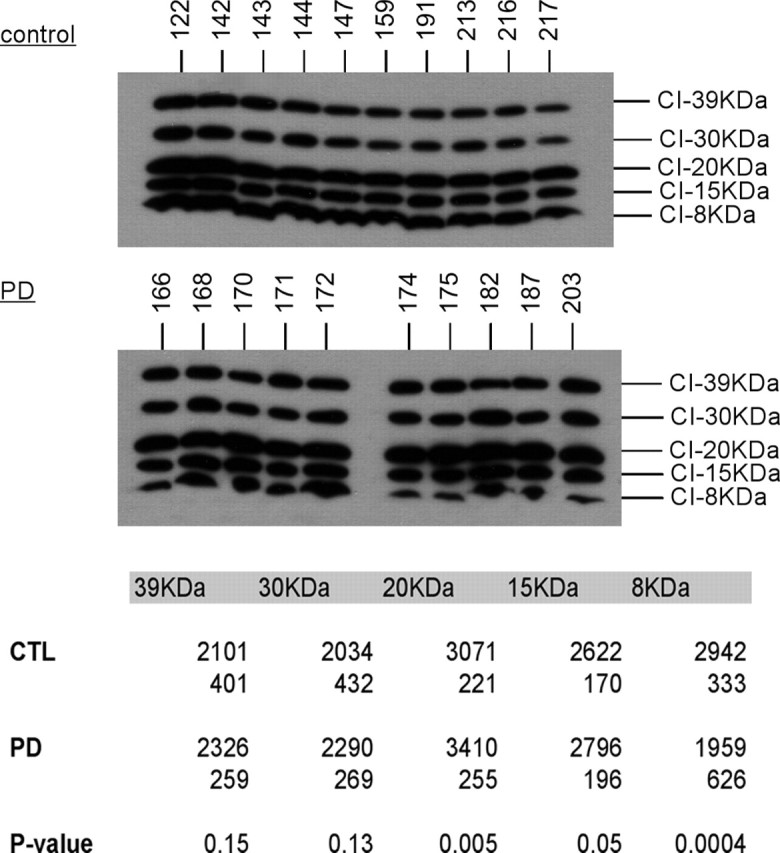
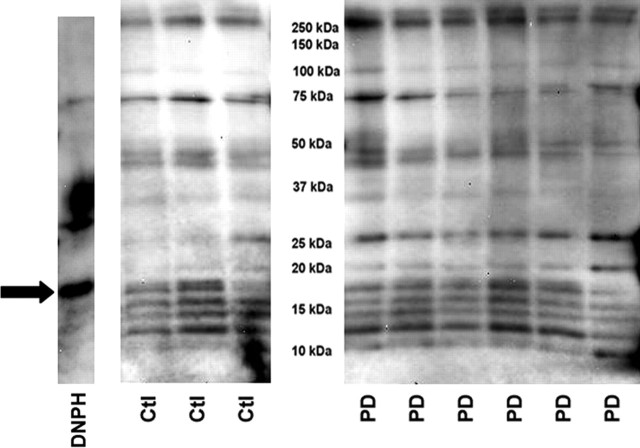
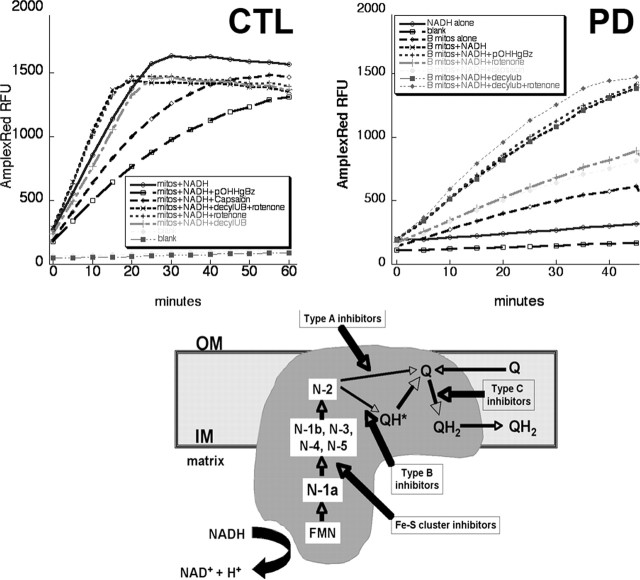
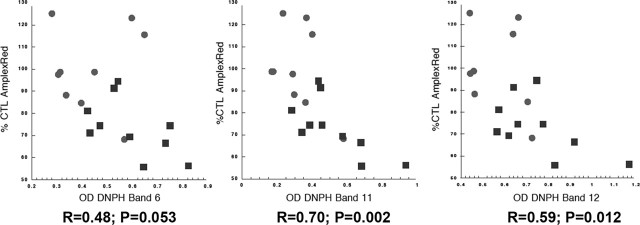
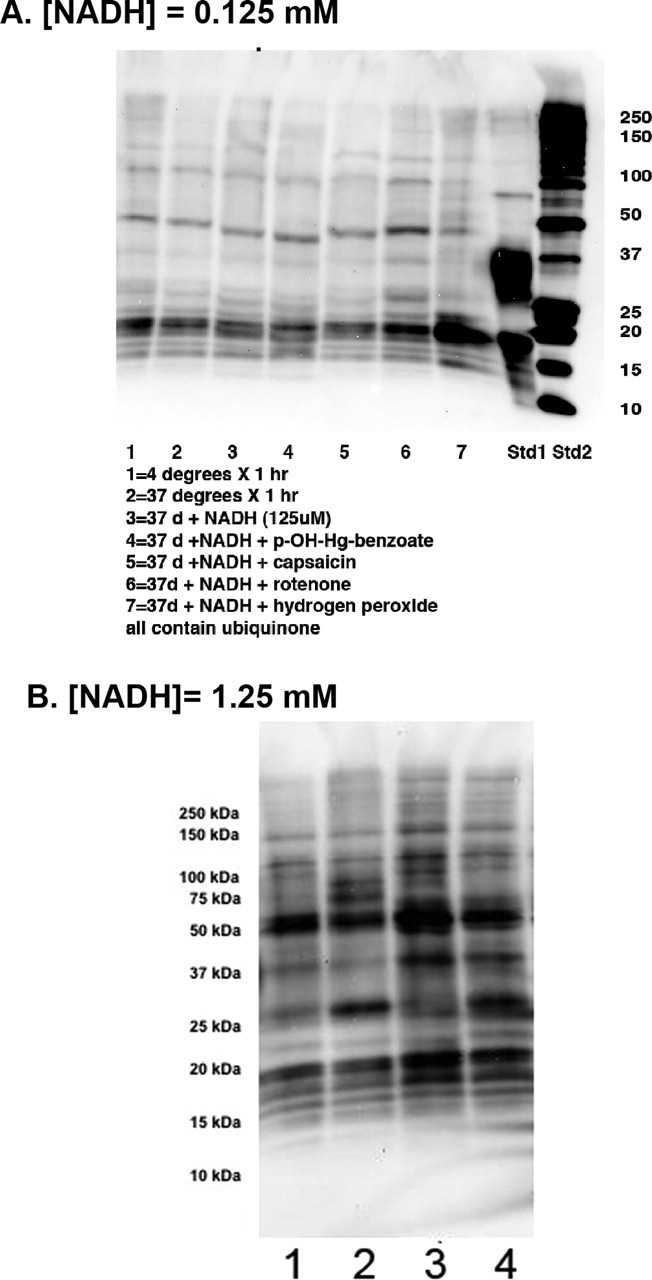
Loss of mitochondrial complex I catalytic activity in the electron transport chain (ETC) is found in multiple tissues from individuals with sporadic Parkinson's disease (PD) and is a property of some PD model neurotoxins. Using special ETC subunit-specific and complex I immunocapture antibodies directed against the entire complex I macroassembly, we quantified ETC proteins and protein oxidation of complex I subunits in brain mitochondria from 10 PD and 12 age-matched control (CTL) samples. We measured nicotinamide adenine dinucleotide (NADH)-driven electron transfer rates through complex I and correlated these with complex I subunit oxidation levels and reductions of its 8 kDa subunit. PD brain complex I shows 11% increase in ND6, 34% decrease in its 8 kDa subunit and contains 47% more protein carbonyls localized to catalytic subunits coded for by mitochondrial and nuclear genomes We found no changes in levels of ETC proteins from complexes II-V. Oxidative damage patterns to PD complex I are reproduced by incubation of CTL brain mitochondria with NADH in the presence of rotenone but not by exogenous oxidant. NADH-driven electron transfer rates through complex I inversely correlate with complex I protein oxidation status and positively correlate with reduction in PD 8 kDa subunit. Reduced complex I function in PD brain mitochondria appears to arise from oxidation of its catalytic subunits from internal processes, not from external oxidative stress, and correlates with complex I misassembly. This complex I auto-oxidation may derive from abnormalities in mitochondrial or nuclear encoded subunits, complex I assembly factors, rotenone-like complex I toxins, or some combination.
Figures

Similar articles
-
Impaired complex-I mitochondrial biogenesis in Parkinson disease frontal cortex.J Parkinsons Dis. 2012;2(1):67-76. doi: 10.3233/JPD-2012-11074. J Parkinsons Dis. 2012. PMID: 23939409
-
Rapid purification and mass spectrometric characterization of mitochondrial NADH dehydrogenase (Complex I) from rodent brain and a dopaminergic neuronal cell line.Mol Cell Proteomics. 2005 Jan;4(1):84-96. doi: 10.1074/mcp.M400143-MCP200. Epub 2004 Dec 10. Mol Cell Proteomics. 2005. PMID: 15591592
-
Mitochondrial activity in the frontal cortex area 8 and angular gyrus in Parkinson's disease and Parkinson's disease with dementia.Brain Pathol. 2018 Jan;28(1):43-57. doi: 10.1111/bpa.12474. Epub 2017 Mar 16. Brain Pathol. 2018. PMID: 27984680 Free PMC article.
-
Molecular Alterations in Core Subunits of Mitochondrial Complex I and Their Relation to Parkinson's Disease.Mol Neurobiol. 2025 Jun;62(6):6968-6982. doi: 10.1007/s12035-024-04526-5. Epub 2024 Sep 27. Mol Neurobiol. 2025. PMID: 39331353 Review.
-
Complex I and Parkinson's disease.IUBMB Life. 2001 Sep-Nov;52(3-5):135-41. doi: 10.1080/15216540152845939. IUBMB Life. 2001. PMID: 11798025 Review.
Cited by
-
Anti-oxidant polydatin (piceid) protects against substantia nigral motor degeneration in multiple rodent models of Parkinson's disease.Mol Neurodegener. 2015 Mar 2;10:4. doi: 10.1186/1750-1326-10-4. Mol Neurodegener. 2015. PMID: 26013581 Free PMC article.
-
Not So Dead Genes-Retrocopies as Regulators of Their Disease-Related Progenitors and Hosts.Cells. 2021 Apr 15;10(4):912. doi: 10.3390/cells10040912. Cells. 2021. PMID: 33921034 Free PMC article. Review.
-
Oxidative damage to macromolecules in human Parkinson disease and the rotenone model.Free Radic Biol Med. 2013 Sep;62:111-120. doi: 10.1016/j.freeradbiomed.2013.01.003. Epub 2013 Jan 15. Free Radic Biol Med. 2013. PMID: 23328732 Free PMC article. Review.
-
The Docosanoid Neuroprotectin D1 Induces TH-Positive Neuronal Survival in a Cellular Model of Parkinson's Disease.Cell Mol Neurobiol. 2015 Nov;35(8):1127-36. doi: 10.1007/s10571-015-0206-6. Epub 2015 Jun 6. Cell Mol Neurobiol. 2015. PMID: 26047923 Free PMC article.
-
Mitochondrial therapies for Parkinson's disease.Mov Disord. 2010;25 Suppl 1(Suppl 1):S155-60. doi: 10.1002/mds.22781. Mov Disord. 2010. PMID: 20187246 Free PMC article.
References
-
- Antonicka H, Ogilvie I, Taivassalo T, Anitori RP, Haller RG, Vissing J, Kennaway NG, Shoubridge EA (2003). Identification and characterization of a common set of complex I assembly intermediates in mitochondria from patients with complex I deficiency. J Biol Chem 278:43081–43088. - PubMed
-
- Chen YR, Chen CL, Zhang L, Green-Church KB, Zweier JL (2005). Superoxide generation from mitochondrial NADH dehydrogenase induces self-inactivation with specific protein radical formation. J Biol Chem 280:37339–37348. - PubMed
-
- Genova ML, Pich MM, Bernacchia A, Bianchi C, Biondi A, Bovina C, Falasca AI, Formiggini G, Castelli GP, Lenaz G (2004). The mitochondrial production of reactive oxygen species in relation to aging and pathology. Ann NY Acad Sci 1011:86–100. - PubMed
-
- Greenamyre JT, Betarbet R, Sherer TB (2003). The rotenone model of Parkinson's disease: genes, environment and mitochondria. Parkinsonism Relat Disord 9:[Suppl 2], S59–S64. - PubMed
-
- Gu M, Cooper JM, Taanman JW, Schapira AH (1998). Mitochondrial DNA transmission of the mitochondrial defect in Parkinson's disease. Ann Neurol 44:177–186. - PubMed
Publication types
MeSH terms
Substances
Grants and funding
LinkOut - more resources
Full Text Sources
Other Literature Sources
Medical