

1H-MR spectroscopy, magnetization transfer, and diffusion-weighted imaging in alcoholic and nonalcoholic patients with cirrhosis with hepatic encephalopathy
- PMID: 16687536
- PMCID: PMC7975732
1H-MR spectroscopy, magnetization transfer, and diffusion-weighted imaging in alcoholic and nonalcoholic patients with cirrhosis with hepatic encephalopathy
Abstract
Purpose: Mild swelling of astrocytes is proposed as a key event in the pathogenesis of hepatic encephalopathy. Proton MR spectroscopy ((1)H-MR spectroscopy), diffusion-weighted imaging (DWI), and magnetization transfer imaging were performed in patients with alcoholic and nonalcoholic liver cirrhosis and correlated with different clinical stages of hepatic encephalopathy to assess alterations in cerebral water metabolism in different subgroups of patients with cirrhosis.
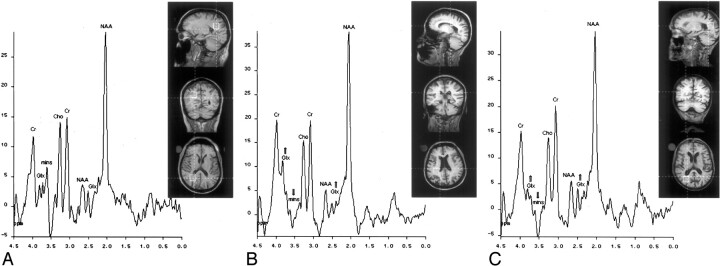
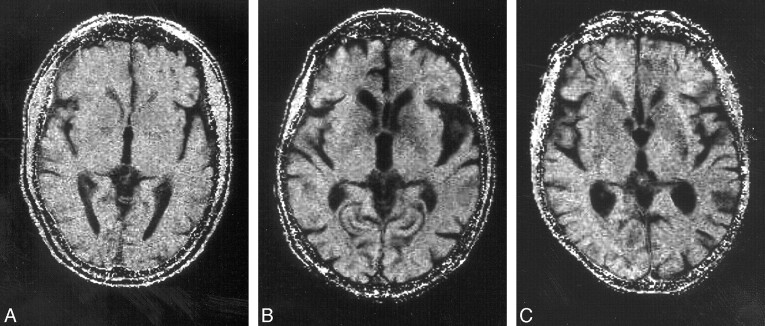
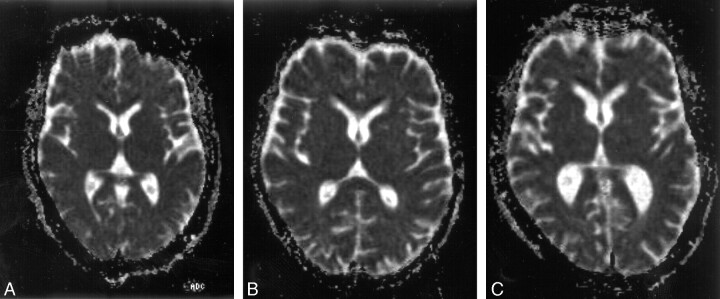
Material and methods: Forty-five patients (26 alcoholics, 19 nonalcoholics [due to hepatitis C (n = 9), hemochromatosis (n = 2), primary chronic cholangitis (n = 2), hepatitis B (n = 1), Wilson disease (n = 1), cryptogenic cirrhosis (n = 4)]) and 18 controls underwent (1)H-MR spectroscopy, magnetization transfer imaging, and DWI of the basal ganglia and normally appearing occipital white matter (NAWM). N-acetylaspartate (NAA), choline (Cho), myo-inositol (mIns), and glutamine/glutamate (Glx) relative to creatine (Cr), the apparent diffusion coefficients (ADC), and the magnetization transfer ratios (MTR) were correlated to the neuropsychologic status, which was assessed by computerized psychometry and mental state grading, according to the West Haven criteria.
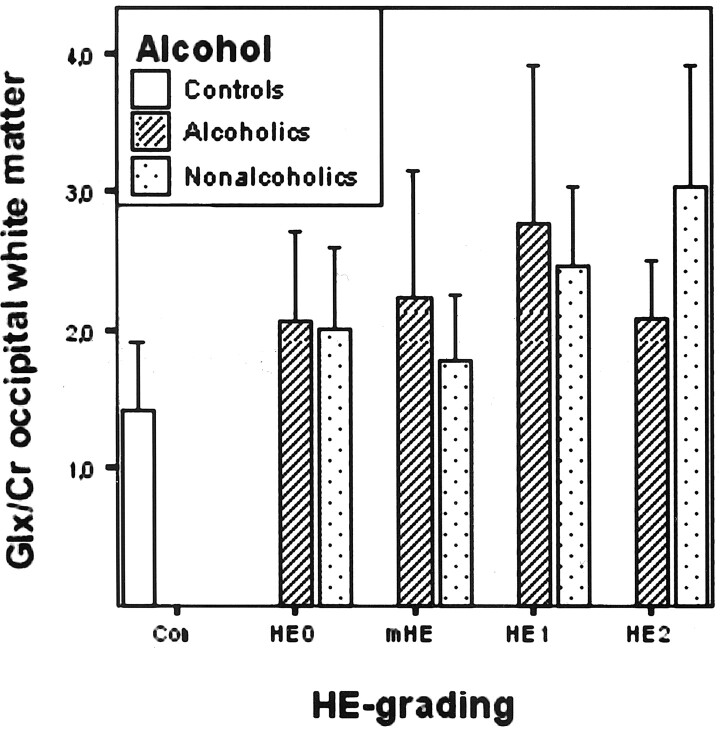
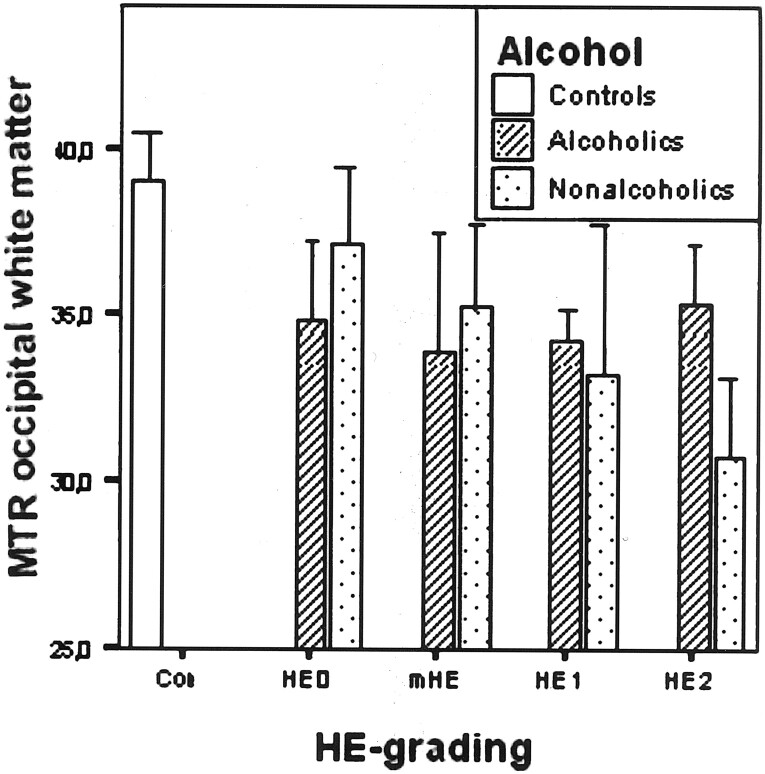
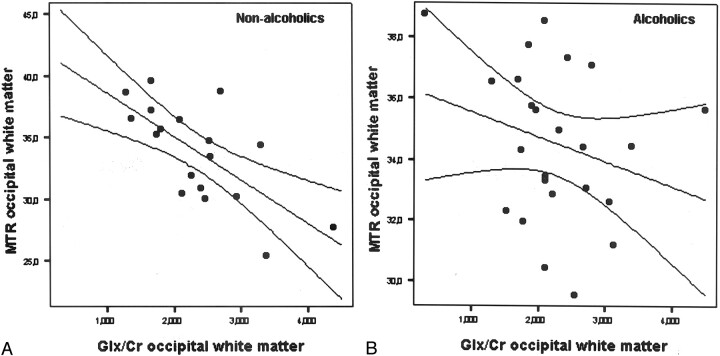
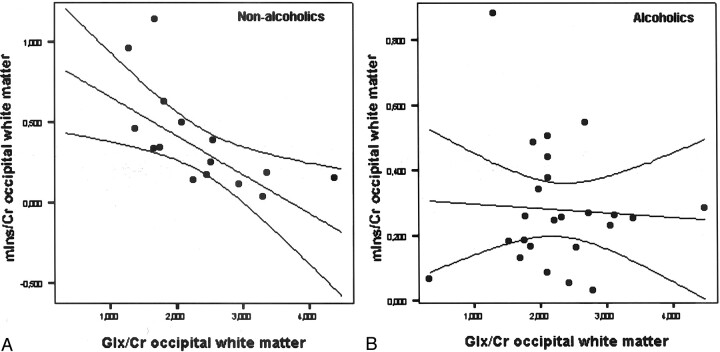
Results: Compared with controls, nonalcoholic subjects exhibited a gradual increase of Glx/Cr in the basal ganglia and NAWM; a decrease in mIns/Cr; a significant decrease of MTR in the thalamus, the putamen, the pallidum, and NAWM; and an increase in the ADC of the NAWM with increasing hepatic encephalopathy severity. In alcoholics, mIns/Cr of the basal ganglia and the NAWM, Cho/Cr of the basal ganglia, and MTR of all assessed regions were decreased. Glx/Cr of the basal ganglia and of the NAWM was increased, compared with that of controls; but no correlation to the clinical hepatic encephalopathy grading was found. ADC did not change significantly between the groups.
Conclusions: Apart from a typical pattern of (1)H-MR spectroscopy alterations in hepatic encephalopathy, a gradual decrease in MTR and an increase of ADC was found correlating to clinical grading of hepatic encephalopathy in nonalcoholic patients with cirrhosis. In alcoholic patients with hepatic encephalopathy, there was no such correlation. Abnormalities detected by MR imaging may hint at different pathways of brain damage in alcohol-induced liver disease.
Figures
Similar articles
-
Minimal hepatic encephalopathy in children with liver cirrhosis: diffusion-weighted MR imaging and proton MR spectroscopy of the brain.Neuroradiology. 2014 Oct;56(10):885-91. doi: 10.1007/s00234-014-1409-0. Epub 2014 Jul 25. Neuroradiology. 2014. PMID: 25060166 Clinical Trial.
-
Magnetization transfer ratio values and proton MR spectroscopy of normal-appearing cerebral white matter in patients with liver cirrhosis.AJNR Am J Neuroradiol. 2001 Jun-Jul;22(6):1137-42. AJNR Am J Neuroradiol. 2001. PMID: 11415910 Free PMC article.
-
Evaluation of early cerebral metabolic, perfusion and microstructural changes in HCV-positive patients: a pilot study.J Hepatol. 2013 Oct;59(4):651-7. doi: 10.1016/j.jhep.2013.05.008. Epub 2013 May 13. J Hepatol. 2013. PMID: 23680314
-
1H magnetic resonance in the study of hepatic encephalopathy in humans.Metab Brain Dis. 2002 Dec;17(4):415-29. doi: 10.1023/a:1021926405944. Metab Brain Dis. 2002. PMID: 12602517 Review.
-
Brain Edema in Chronic Hepatic Encephalopathy.J Clin Exp Hepatol. 2019 May-Jun;9(3):362-382. doi: 10.1016/j.jceh.2019.02.003. Epub 2019 Feb 19. J Clin Exp Hepatol. 2019. PMID: 31360029 Free PMC article. Review.
Cited by
-
Chemical exchange saturation transfer imaging in hepatic encephalopathy.Neuroimage Clin. 2019;22:101743. doi: 10.1016/j.nicl.2019.101743. Epub 2019 Mar 4. Neuroimage Clin. 2019. PMID: 30856541 Free PMC article.
-
Global brain metabolic quantification with whole-head proton MRS at 3 T.NMR Biomed. 2017 Oct;30(10):10.1002/nbm.3754. doi: 10.1002/nbm.3754. Epub 2017 Jul 5. NMR Biomed. 2017. PMID: 28678429 Free PMC article.
-
Early detection of hepatic encephalopathy after transjugular intrahepatic portsystemic shunt using multiparametric magnetic resonance with spectroscopy.Eur J Radiol Open. 2019 Dec 2;6:350-357. doi: 10.1016/j.ejro.2019.09.002. eCollection 2019. Eur J Radiol Open. 2019. PMID: 31886319 Free PMC article.
-
Brain default-mode network abnormalities in hepatic encephalopathy: a resting-state functional MRI study.Hum Brain Mapp. 2012 Jun;33(6):1384-92. doi: 10.1002/hbm.21295. Epub 2011 May 12. Hum Brain Mapp. 2012. PMID: 21567661 Free PMC article.
-
RNA oxidation and zinc in hepatic encephalopathy and hyperammonemia.Metab Brain Dis. 2009 Mar;24(1):119-34. doi: 10.1007/s11011-008-9125-2. Epub 2009 Jan 16. Metab Brain Dis. 2009. PMID: 19148713 Review.
References
-
- Häussinger D, Laubenberger J, vom Dahl S, et al., Proton magnetic resonance spectroscopy studies on human brain myo-inositol in hypo-osmolarity and hepatic encephalopathy. Gastroenterology 1994;107:1475–80 - PubMed
-
- Kreis R, Ross BD. Cerebral metabolic disturbances in patients with subacute and chronic diabetes mellitus: detection with proton MR spectroscopy. Radiology 1992;184:123–30 - PubMed
-
- Laubenberger J, Haussinger D, Bayer S, et al., Proton magnetic resonance spectroscopy of the brain in symptomatic and asymptomatic patients with liver cirrhosis. Gastroenterology 1997;112:1610–16 - PubMed
-
- Cordoba J, Alonso J, Rovira A, et al. The development of low-grade cerebral edema in cirrhosis is supported by the evolution of (1)H-magnetic resonance abnormalities after liver transplantation. J Hepatol 2001;35:598–604 - PubMed
-
- Geissler A, Lock G, Frund R, et al. Cerebral abnormalities in patients with cirrhosis detected by proton magnetic resonance spectroscopy and magnetic resonance imaging. Hepatology 1997;25:48–54 - PubMed
MeSH terms
Substances
LinkOut - more resources
Full Text Sources
Medical