. 2006 May;27(5):1113-8.

Hemodynamics in a cerebral artery before and after the formation of an aneurysm

Affiliations

Hemodynamics in a cerebral artery before and after the formation of an aneurysm

A Mantha et al. AJNR Am J Neuroradiol. 2006 May.

Abstract

Using data obtained from 3D digital subtraction angiography acquisitions, computational fluid dynamics techniques were used first to assess hemodynamic factors in geometrically correct models of 3 paraclinoid aneurysms and then again for assessment after virtual removal of the aneurysms and reconstruction of the parent artery. Simulations revealed an area of relatively low and rotating wall shear stresses at the location at which each aneurysm had developed. This phenomenon, to our knowledge, has not been previously described.


Figures
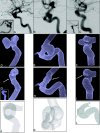
Fig 1.
Fig 1.
AC, Lateral views (DSA) of 3 sidewall aneurysms of the paraclinoid internal carotid artery. The aneurysms vary in their orientation to the vessel axis. A, (Case I) the aneurysm dome extends more distally than proximally. B, (Case II) the dome extends more proximally than distally (as opposed to A). C, (Case III) the dome extends equally in both directions. Insets in A and C show the aneurysms in tangential projections according to their orientation laterally from the right internal carotid artery (ICA) (A), and medially from the left ICA (C). DF, The 3D computational domain, obtained from 3D angiography of the 3 aneurysms, is shown. D and F are aligned according to their orientation in the insets of A and C. GI, Geometries in identical projection to DF, respectively, after artificial removal of the aneurysms by using a smoothing algorithm. The inset in Fig G, oriented according to the initial DSA (A), was chosen to highlight the effects of wall shear stress at the ostium plane for case I. Its orientation is identical to J showing the ostium “en face” and to the one in Fig 3, AD. JL, “En face” projections of the aneurysm ostium (transparent grids).
Fig 2.
Fig 2.
Flow waveform, Q (t) (based on Ku et al), obtained as a solution to the imposed pressure gradient. At 0.192s diastole ends, followed by peak flow rate at 0.281 s. Maximum amplitude in the secondary flow velocities is achieved during midsystolic deceleration (MSD) at t = 0.305 s. Results of the simulations are shown subsequently at these 3 critical times of the cardiac cycle.
Fig 3.
Fig 3.
(Case I) Distribution of wall shear stresses (WSS) in the internal carotid artery at the level of the aneurysm in case I. A and C represent the conditions before aneurysmal development (based on artificial aneurysm removal as described above) at end diastole (A) and peak systole (C), whereas B and D show the conditions after aneurysm development, respectively. The WSS vectors (small black arrows), clipped to display the WSS behavior mainly in the vicinity of the aneurysm, are superimposed on contour plots of WSS magnitude. Blue corresponds to spatial minimum and red corresponds to spatial maximum. Range of WSS magnitudes: A and B, 0–16 Pa; C and D, 0–100 Pa. Range of WSS vectors: A and B, 0–5 Pa; C and D, 0–30 Pa. Note that the WSS in the area of subsequent aneurysm development (A and C) is relatively low at both end diastole and peak systole. The random orientation of these vectors indicates a stagnation zone in this area.
Fig 4.
Fig 4.
(Case I) Secondary flow (flow perpendicular to the vessel axis) patterns visualized by using velocity vectors projected in a cross-sectional plane perpendicular to the vessel axis. Lateral view (A) and “en face” view (B) of the cross-sectional plane. Note that A was generated by rotating (1G) counter-clockwise 90°. This was done to better visualize the area of aneurysm development located mainly on the medial side of the vessel wall. C and D correspond to velocity vectors superimposed on the contours of secondary velocity magnitude during end diastole (C) and midsystolic deceleration (MSD) (D) for case I. Note that the strength of eddies increases during the deceleration phase of systole, which contributes to the formation of stagnation zone. E and F show the velocity vectors for case I at MSD (prior and post aneurysm development), emphasizing the change in the pattern as a result of formation of aneurysm. Range of velocity magnitude: C, 0–5.45 m/s; D, 0–1.3 m/s; E, 0–1.3 m/s; F, 0–1.3 m/s. Range of secondary flow vectors: C, 0–5.133 m/s; D, 0–0.675 m/s; E, 0–0.675 m/s; F, 0–0.72 m/s.
Fig 5.
Fig 5.
Contour plot of the aneurysm formation indicator (AFI) at MSD. The blue color corresponds to complete reversal in wall shear stresses (WSS), green corresponds to a 90° rotation of WSS, and red implies that the instantaneous WSS vector aligns with the reference value, the temporal average of WSS. A, B, and C correspond to cases I, II and III, respectively. The insets show the location of the aneurysms. The most significant values of this indicator tend to correlate with the area of subsequent aneurysm development.

References

    1. Inci S, Spetzler RF. Intracranial aneurysms and arterial hypertension: a review and hypothesis. Surg Neurol 2000;53:530–40; discussion 40–42 - PubMed
    1. Krex D, Schackert HK, Schackert G. Genesis of cerebral aneurysms–an update. Acta Neurochir (Wien) 2001;143:429–48; discussion 48–49 - PubMed
    1. Karmonik C, Arat A, Benndorf G, et al. A technique for improved quantitative characterization of intracranial aneurysms. AJNR Am J Neuroradiol 2004;25:1158–61 - PMC - PubMed
    1. Kar B, Delgado RM 3rd, Radovancevic B, et al. Vascular thrombosis during support with continuous flow ventricular assist devices: correlation with computerized flow simulations. Congest Heart Fail 2005;11:182–87 - PubMed
    1. Ku DN. Blood flow in arteries. Annu Rev Fluid Mech 1997;29:399–434

MeSH terms