. 2006 Jul;17(7):3291-303.
doi: 10.1091/mbc.e06-01-0067. Epub 2006 May 10.

Rho kinase, myosin-II, and p42/44 MAPK control extracellular matrix-mediated apical bile canalicular lumen morphogenesis in HepG2 cells

Affiliations

Rho kinase, myosin-II, and p42/44 MAPK control extracellular matrix-mediated apical bile canalicular lumen morphogenesis in HepG2 cells

Hilde Herrema et al. Mol Biol Cell. 2006 Jul.

Abstract

The molecular mechanisms that regulate multicellular architecture and the development of extended apical bile canalicular lumens in hepatocytes are poorly understood. Here, we show that hepatic HepG2 cells cultured on glass coverslips first develop intercellular apical lumens typically formed by a pair of cells. Prolonged cell culture results in extensive organizational changes, including cell clustering, multilayering, and apical lumen morphogenesis. The latter includes the development of large acinar structures and subsequent elongated canalicular lumens that span multiple cells. These morphological changes closely resemble the early organizational pattern during development, regeneration, and neoplasia of the liver and are rapidly induced when cells are cultured on predeposited extracellular matrix (ECM). Inhibition of Rho kinase or its target myosin-II ATPase in cells cultured on glass coverslips mimics the morphogenic response to ECM. Consistently, stimulation of Rho kinase and subsequent myosin-II ATPase activity by lipoxygenase-controlled eicosatetranoic acid metabolism inhibits ECM-mediated cell multilayering and apical lumen morphogenesis but not initial apical lumen formation. Furthermore, apical lumen remodeling but not cell multilayering requires basal p42/44 MAPK activity. Together, the data suggest a role for hepatocyte-derived ECM in the spatial organization of hepatocytes and apical lumen morphogenesis and identify Rho kinase, myosin-II, and MAPK as potentially important players in different aspects of bile canalicular lumen morphogenesis.


Figures

Figure 1.
Figure 1.
Schematic drawing that shows the orientation of the apical lumen shared by a pair or a group of hepatocytes (left side) in comparison with other epithelial cells such as those found in the kidney or intestine (right side). Dotted and solid lines represent the apical and basolateral surfaces, respectively.
Figure 2.
Figure 2.
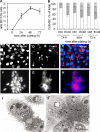
ECM affects apical lumen morphology in HepG2 cell cultures. (A) Apical polarity development in HepG2 cells as a function of time after plating, expressed as the ratio BC/100 cells. Data are expressed as mean ± SD of three independent experiments carried out in duplicate. (B) Average number of cells participating in a single BC (expressed as the ratio cells/BC) as a function of time after plating on glass coverslips (Ctrl) or predeposited ECM (ECM). Data are expressed as mean ± SD of three independent experiments carried out in duplicate. White, hatched, gray, and dotted bars represent BC shared by two, three, four, or more than five cells, respectively. Student's t tests to determine the statistical significance between Ctrl and ECM at 24 h: white bars, p < 0.02; hatched bars, p < 0.003; gray bars, p = 0.11; dotted bars, p = 0.2; at 48 h: white bars, p < 0.003; hatched bars, p = 0.4; gray bars, p < 0.001; dotted bars p < 0.05; at 72 h: white bars, p < 0.01; hatched bars, p = 0.26; gray bars, p = 0.07; dotted bars, p < 0.05. Student's t tests to determine the statistical significance of control cells between 24 and 48 h, p < 0.05; between 48 and 72 h, p < 0.01. (C–H) Polarized morphology of HepG2 cells plated on glass coverslips (C–E) or predeposited ECM (F–H). Hoechst-stained nucleus in C and F, TRITC-phalloidin stained BC in D and G, and merged pictures in E and H. Bars, 10 μm. (I and J) TEM image of polarized HepG2 cells plated on glass coverslips (I) or predeposited ECM (J). N, nucleus. Bar, 5 μm.
Figure 3.
Figure 3.
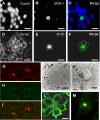
ECM-remodeled lumens display apical membrane identity. (A–C) Apical lumens in cells cultured for 3 d on predeposited ECM present the canalicular transporter MDR1 (A, nuclei; B, MDR1; and C, merged image). (D–F) The MDR1 substrate R123 is translocated and contained in the apical lumen of cells cultured on predeposited ECM for 3 d (D, phase contrast; E, R123; and F, merged image). (G–I) Tight junction protein ZO-1 (H) borders the apical domain, visualized with TRITC-phalloidin (G). Merged image in I. (J and K) TEM image of the apical lumen (J, black asterisk) and apical junctions (K, arrows) of cells (indicated with white asterisks in J) cultured on predeposited ECM. (L) C6-NBD-SM at the basolateral surface does not diffuse to the apical membrane (asterisk) of cells cultured on predeposited ECM. (M) C6-NBD-SM in the apical plasma membrane domain of cells cultured on predeposited ECM does not diffuse to the basolateral domain. Bars in A-I, L, and M, 10 μm. Bars in J and K, 2 μm and 100 nm, respectively.
Figure 4.
Figure 4.
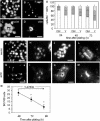
Involvement of ROCK activity in apical lumen morphogenesis. (A–D) Inhibition of ROCK in cells cultured on glass coverslips with Y-27632 for 3 d induces apical lumen remodeling (C and D), compared with nontreated cells (A and B). A and C, DAPI-stained nuclei; B, TRITC-phalloidin–labeled BC; D, villin-labeled BC. (E) Average number of cells that participate in a single BC of control (Ctrl) or Y-27632–treated (Y) cells as a function of time after plating. White, hatched, gray, and dotted bars represent BC shared by two, three, four, or more than five cells, respectively. Student's t tests: 24 h: Ctrl versus Y-27632, white bars, p < 0.001; hatched bars, p < 0.004; gray bars, p < 0.02; dotted bars, p = 0.2; 48 h: Ctrl versus Y-27632, white bars, p < 0.01; hatched bars, p < 0.02; gray bars, p < 0.004; dotted bars p < 0.01; and 72 h: Ctrl versus Y-27632, white bars, p < 0.001; hatched bars, p < 0.05; gray bars, p < 0.01; dotted bars, p < 0.005. (F–M) Cells were cultured for 48 h and treated with Y-27632 for 0 h (F and G), 24 h (H and I), 48 h (J and K), or 72 h (L and M). Cells were fixed and labeled with DAPI to visualize the nuclei (F, H, J, and L) and TRITC-phalloidin to visualize the BC lumens (G, I, K, and M). Bars, 10 μm. (N) Cells were cultured for 48 h and treated with Y-27632 for 0, 24, or 48 h. Cells were fixed and labeled with DAPI and TRITC-phalloidin to calculate the ratio BC/100 cells. Data are expressed as mean ± SD of three independent experiments carried out in duplicate. *p < 0.05.
Figure 5.
Figure 5.
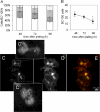
Apical lumen remodeling in cells cultured on glass coverslips for >48 h. Cells were cultured on glass coverslips for 48 h and subsequently for another 0, 24, or 48 h. Cells were then fixed, and the ratio cells/BC (A) and BC/100 cells (B) was determined as described in Materials and Methods. Data are expressed as mean ± SD of three independent experiments carried out in duplicate. *p < 0.05. (C–E) Cells cultured on glass coverslips for 72 h were fixed and (immuno)labeled with anti-MRP2 antibodies (C–C’″) and TRITC-labeled phalloidin (D) and subjected to laser scanning confocal microscopical. Multiple x-y sections (1/0.5 μm) were superimposed. A merged image is shown in E. C’ and C″ are enlargements of the respective boxes in C, and the numbers indicate distinct apical lumens.
Figure 6.
Figure 6.
Effects of ETA metabolism on ECM-mediated apical lumen remodeling. (A) TRITC-phalloidin-labeled apical lumen in cells cultured on ECM for 3 d. (B) TRITC-phalloidin–labeled apical lumen in cells cultured on ECM for 3 d in the presence of ETA. (C) TRITC-phalloidin–labeled apical lumen in cells cultured on ECM for 3 d in the presence of ETA + NDGA. (D) TRITC-phalloidin–labeled apical lumen in cells cultured on ECM for 48 h, followed by treatment with Y-27632 for 24 h. Bar, 10 μm. (E) Average number of cells that participate in a single BC of HepG2 cells cultured on glass coverslips (Ctrl), ECM, ECM + ETA, or ECM + ETA + NDGA for 24 h. White, hatched, gray and dotted bars represent BC shared by two, three, four, or more than five cells, respectively. Student's t tests: white bars, Ctrl versus ECM, p < 0.001; ECM versus ECM + ETA, p < 0.001; ECM + ETA versus ECM + ETA + NDGA, p < 0.001; hatched bars, Ctrl versus ECM, p = 0.006; ECM versus ECM + ETA, p = 0.44; ECM + ETA versus ECM + ETA + NDGA, p = 0.42; gray bars, Ctrl versus ECM, p = 0.90; ECM versus ECM + ETA, p = 0.14; ECM + ETA versus ECM + ETA + NDGA, p = 0.03; and dotted bars, Ctrl versus ECM, p = 0.008; ECM versus ECM + ETA, p = 0.014; ECM + ETA versus ECM + ETA + NDGA, p = 0.39.
Figure 7.
Figure 7.
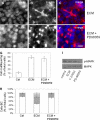
Involvement of myosin II in apical lumen remodeling. (A) Western blot showing expression level of phosphorylated MLC2 and total MLC2 in cells cultured on glass coverslips (no ECM) that were untreated or treated with ETA or ETA + Y-27632 for 24 h, and in cells cultured on predeposited ECM that were untreated or treated with ETA for 24 h. (B) The mean normalized alteration in MLC2 phosphorylation was calculated by quantification of electrophoretic bands of three experiments using Scion Image software, expressed as (phospho-MLC2/total MLC2) × 100%, and presented as percentage of control. *p < 0.05 in a Student's t test (ETA versus control, ETA + Y-27632 versus control, controlECM versus control, ETAECM versus controlECM). (C) MLC2 localizes to the tight junction area of HepG2 cells. (D) Phosphorylated MLC2 localizes to the tight junction area and nucleus of HepG2 cells. (E and F) Culturing HepG2 cells on glass coverslips in the presence of BDM for 24 h induces apical lumen remodeling (E), compared with nontreated cells (D). (F) The average number of cells that participate in a single BC in HepG2 cells cultured for 24 h in the presence or absence of BDM. White, hatched, gray, and dotted bars represent BC shared by two, three, four, or more than five cells, respectively. Student's t tests: white bars, Ctrl versus BDM, p < 0.001; hatched bars, Ctrl versus BDM, p < 0.001; gray bars, Ctrl versus BDM, p = 0.001; dotted bars, Ctrl versus BDM, p = 0.002.
Figure 8.
Figure 8.
Apical lumen remodeling but not cell multilayering requires MAPK signaling. (A–C) Apical lumen remodeling in cells cultured on predeposited ECM for 72 h (A, nuclei; B, TRITC-phalloidin; and C, merged image). (D–F) Apical lumen remodeling in response to predeposited ECM is inhibited by PD98059 (D, nuclei; E, TRITC-phalloidin; and F, merged image). Bar, 10 μm. (G) Percentage of total cells that display multilayering (see Materials and Methods) when cultured on glass coverslips or on predeposited ECM for 72 h in the presence of absence of PD98059. Student's t test: Ctrl versus ECM, p < 0.001; Ctrl versus ECM + PD98059, p = 0.001; ECM versus ECM + PD98059, p = 0.48. (H) Average number of cells participating in a single BC in cell cultured on glass coverslips or on predeposited ECM for 72 h in the presence or absence of PD98059. White, hatched, gray, and dotted bars represent BC shared by two, three, four, or more than five cells, respectively. Student's t tests: white bars, Ctrl versus ECM, p < 0.001; ECM versus ECM + PD98059, p < 0.001; hatched bars, Ctrl versus ECM, p < 0.001; ECM versus ECM + PD98059, p < 0.001; gray bars, Ctrl versus ECM, p < 0.001; ECM versus ECM + PD98059, p = 0.002; dotted bars, Ctrl versus ECM, p < 0.001; ECM versus ECM + PD98059, p < 0.001. (I) Western blot showing expressing levels of p42/44 MAPK and phospho-MAPK in control cells, cells cultured on predeposited ECM for 72 h, or cells cultured in the presence of Y-27632 or PD-98059 for 72 h. Note the virtual absence of phosphorylated MAPK in PD98059-treated cells, whereas ECM and Y-27632 have no effect on the level of phosphorylated MAPK.

Similar articles

Cited by

References

    1. Abu-Absi S. F., Friend J. R., Hansen L. K., Hu W. S. Structural polarity and functional bile canaliculi in rat hepatocyte spheroids. Exp. Cell Res. 2002;274:56–67. - PubMed
    1. Aït Slimane T., Trugnan G., van IJzendoorn S.C.D., Hoekstra D. Raft-mediated trafficking of apical resident proteins occurs in both direct and transcytotic pathways in polarized hepatic cells: role of distinct lipid microdomains. Mol. Biol. Cell. 2003;14:611–624. - PMC - PubMed
    1. Araki S., Ito M., Kureishi Y., Feng J., Machida H., Isaka N., Amano M., Kaibuchi K., Hartshorne D. J., Nakano T. Arachidonic acid-induced Ca2+ sensitization of smooth muscle contraction through activation of Rho-kinase. Pflueg. Arch. Eur. J. Physiol. 2001;441:596–603. - PubMed
    1. Bouma M. E., Rogier E., Verthier N., Labarre C., Feldmann G. Further cellular investigation of the human hepatoblastoma-derived cell line HepG 2, morphology and immunocytochemical studies of hepatic-secreted proteins. In Vitro Cell Dev. Biol. 1989;25:267–275. - PubMed
    1. Bertet C., Sulak L., Lecuit T. Myosin-dependent junction remodelling controls planar cell intercalation and axis elongation. Nature. 2004;429:667–671. - PubMed

Publication types

MeSH terms

Substances

LinkOut - more resources