Kinetics of error generation in homologous B-family DNA polymerases
- PMID: 16687658
- PMCID: PMC1459414
- DOI: 10.1093/nar/gkl300
Kinetics of error generation in homologous B-family DNA polymerases
Abstract
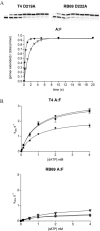
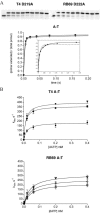
The kinetics of forming a proper Watson-Crick base pair as well incorporating bases opposite furan, an abasic site analog, have been well characterized for the B Family replicative DNA polymerase from bacteriophage T4. Structural studies of these reactions, however, have only been performed with the homologous enzyme from bacteriophage RB69. In this work, the homologous enzymes from RB69 and T4 were compared in parallel reactions to determine the relative abilities of the two polymerases to incorporate correct nucleotides as well as to form improper pairings. The kinetic rates for three different exonuclease mutants for each enzyme were measured for incorporation of an A opposite T and an A opposite furan as well as for the formation of A:C and T:T mismatches. The T4 exonuclease mutants were all approximately 2- to 7-fold more efficient than the corresponding RB69 exonuclease mutants depending on whether a T or furan was in the templating position and which exonuclease mutant was used. The rates for mismatch formation by T4 were significantly reduced compared with incorporation opposite furan, much more so than the corresponding RB69 mutant. These results show that there are kinetic differences between the two enzymes but they are not large enough to preclude structural assumptions for T4 DNA polymerase based on the known structure of the RB69 DNA polymerase.
Figures


References
-
- Capson T.L., Peliska J.A., Kaboord B.F., Frey M.W., Lively C., Dahlberg M., Benkovic S.J. Kinetic characterization of the polymerase and exonuclease activities of the gene 43 protein of bacteriophage T4. Biochemistry. 1992;31:10984–10994. - PubMed
-
- Doublié S., Tabor S., Long A.M., Richardson C.C., Ellenberger T. Crystal structure of a bacteriophage T7 DNA replication complex at 2.2 A resolution. Nature. 1998;391:251–258. - PubMed
-
- Franklin M.C., Wang J., Steitz T.A. Structure of the replicating complex of a pol alpha family DNA polymerase. Cell. 2001;105:657–667. - PubMed
-
- Muzyczka N., Poland R.L., Bessman M.J. Studies on the biochemical basis of spontaneous mutation. I. A comparison of the deoxyribonucleic acid polymerases of mutator, antimutator, and wild type strains of bacteriophage T4. J. Biol. Chem. 1972;247:7116–7122. - PubMed
-
- Drake J.W. Comparative rates of spontaneous mutation. Nature. 1969;221:1132. - PubMed
Publication types
MeSH terms
Substances
Grants and funding
LinkOut - more resources
Full Text Sources
Other Literature Sources

