. 2006 Jun 7;25(11):2652-61.
doi: 10.1038/sj.emboj.7601130. Epub 2006 May 11.

Cytotoxin ClyA from Escherichia coli assembles to a 13-meric pore independent of its redox-state

Affiliations

Cytotoxin ClyA from Escherichia coli assembles to a 13-meric pore independent of its redox-state

Nora Eifler et al. EMBO J. .

Abstract

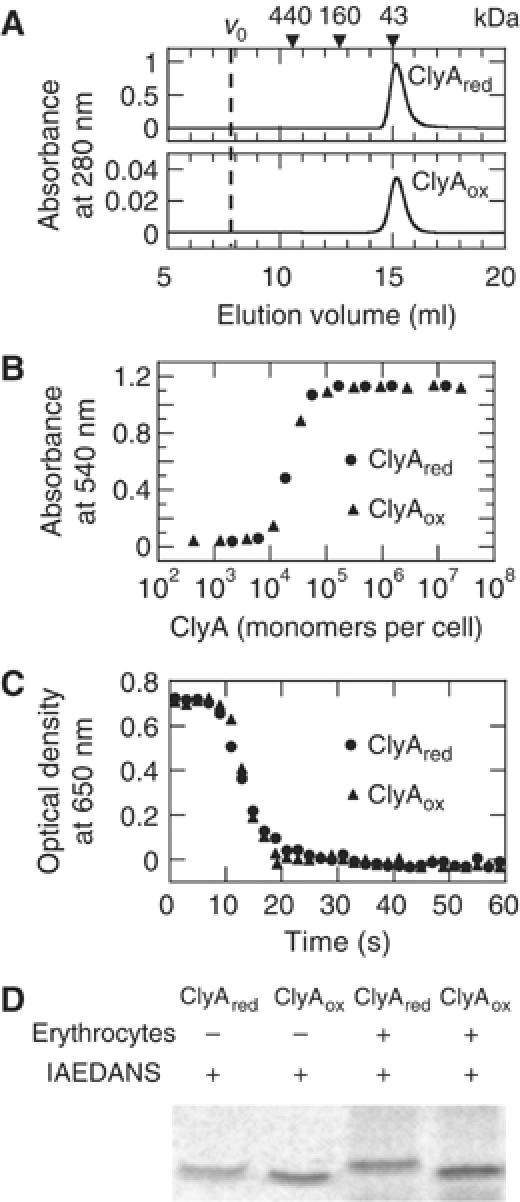
ClyA is a pore-forming toxin from virulent Escherichia coli and Salmonella enterica strains. Here, we show that the intrinsic hemolytic activity of ClyA is independent of its redox state, and that the assembly of both reduced and oxidized ClyA to the ring-shaped oligomer is triggered by contact with lipid or detergent. A rate-limiting conformational transition in membrane-bound ClyA monomers precedes their assembly to the functional pore. We obtained a three-dimensional model of the detergent-induced oligomeric complex at 12 A resolution by combining cryo- and negative stain electron microscopy with mass measurements by scanning transmission electron microscopy. The model reveals that 13 ClyA monomers assemble into a cylinder with a hydrophobic cap region, which may be critical for membrane insertion.


Figures

Figure 1
Figure 1
Structure of Monomeric ClyA. Atomic structure of soluble, monomeric ClyAred (Wallace et al, 2000) with the four-helix bundle formed by helices (A, B, C and F (blue), the β hairpin (yellow) with its flanking helices D and E (orange), and the C-terminal helix G (cyan) that is linked to helix C by a disulfide bridge (C87-C285) in ClyAox.
Figure 2
Figure 2
Activity of reduced and oxidized ClyA. (A) Oligomerization state of ClyAred and ClyAox in PBS at 15°C. ClyAred (100 μM) and ClyAox (5 μM) were subjected to analytical gel filtration. The protein is monomeric, even at high concentrations. Arrows indicate retention volumes of soluble mass standard proteins. v0, void volume. (B) Hemolytic activity of ClyAred and ClyAox at 37°C. Hemolysis of a 1% suspension of horse erythrocytes by ClyAred and ClyAox (concentration range between 0.01 and 1000 nM) was examined using a liquid hemolysis assay according to Rowe and Welch (1994). (C) Kinetics of hemolysis induced by ClyAred and ClyAox at 37°C. The decrease in turbidity upon hemolysis of a 0.1% suspension of horse erythrocytes exposed to 250 nM ClyAred or ClyAox was monitored at 650 nm. (D) Redox state of ClyA after insertion into erythrocyte membranes. 250 nM ClyAred (lanes 1 and 3) or ClyAox (lanes 2 and 4) were added to a 1% suspension of horse erythrocytes (lanes 3 and 4) or PBS (lanes 1 and 2) and incubated for 30 min at 37°C. The samples were thereupon exposed to IAEDANS under denaturing conditions and analyzed by SDS–PAGE (there are no prominent bands of erythrocyte proteins in the mass range of ClyA).
Figure 3
Figure 3
Detergent-induced oligomerization of ClyAred. (A) ClyAred (5 μM) was incubated in 0.1% DDM at 15°C. Samples were taken at the times indicated and subjected to analytical gel filtration in 0.1% DDM at 4°C. For comparison, the elution profile of soluble, monomeric ClyA is shown (left panel). On addition of DDM, monomeric ClyAred immediately associates with detergent, leading to a shift in the elution volume from 15.1 to 12.3 ml. The detergent bound monomer then slowly converts to oligomeric ClyAred, eluting at 9.6 ml. Arrows indicate retention volumes of soluble mass standard proteins. v0, void volume. Peak areas of monomeric ClyAred (right, upper panel) and oligomeric ClyAred (right, lower panel) were plotted against time and fitted with a monoexponential function (black line). (B) Crosslinking analysis of the oligomerization of ClyAred. Samples identical to those in (A) were mixed with DSP and incubated for 5 min at 25°C. The reaction was stopped by addition of Tris/HCl, and samples were applied onto a 16% polyacrylamide–SDS gel (left panel). The bands of monomeric ClyAred were quantified by densitometry, the fraction of monomers was plotted against incubation time (right panel), and fitted with a monoexponential function (black line). (C) Electron-micrograph of negatively stained ClyAred particles taken from the peak eluted at 9.6 ml in (A). (D) Top view class average of 145 negatively stained ClyAred particles. (E) Side view class average of 205 negatively stained ClyAred particles. The scale bars correspond to 40 nm in (C), and 5 nm in (D) and (E).
Figure 4
Figure 4
STEM analysis of the ClyA complex. (A) As shown by the histogram, the masses measured for the unstained ClyA preparation fell into three distinct classes (1, 2, and 3) that on visual inspection of the particles (galleries) could be assigned to single complexes with a mass of 475±86 kDa (n=184; overall uncertainty=25 kDa), two associated complexes, mass 974±140 kDa (n=114; overall uncertainty=49 kDa) and three associated complexes, mass 1357±108 kDa (n=30; overall uncertainty=71 kDa). (B) Dark-field STEM images of the measured ClyA preparation after negative staining. Left, side views of the single complex. Centre, two complexes associated at their tips. Right, three complexes associated at their tips. The high contrast of the STEM allows the individual monomers making up the complex to be distinguished. Either six or seven subunits can be counted on the side views, consistent with 13-fold symmetry. The scale bar corresponds to 20 nm in (A) and (B).
Figure 5
Figure 5
Cryo-EM of vitrified ClyA complexes and model of the ClyA oligomer. (A) Overview image of frozen hydrated particles. The scale bar corresponds to 50 nm. Top and side view class averages, containing 302 and 796 particles each, are shown in the insets. The top view reveals some structure in the channel center while the cap at one end of the pore complex is seen in the side view. The scale bar in the insets corresponds to 2.5 nm. (B) Isocontour representations of the reconstructed single particle density, showing the prominent cap region as well as the open end of the pore. (C) Side by side comparison of the 3D EM reconstruction of the pore with the X-ray structure of monomeric ClyA. The 3D EM isosurface representation is cut open to expose the cavity as well as the inner contour lines of the protein density. (D) Model of a 26-stranded β barrel, the suggested cap structure. The barrel is formed by the β tongues of each of the 13 monomers.
Figure 6
Figure 6
Cryo-EM images of ClyA in lipid vesicles. (A, B) High-resolution micrographs of ClyA incorporated in lipid vesicles in the absence of detergent. Upon contact with brain lipid vesicles, monomeric ClyA forms pore assemblies appearing as ring-like structures with a central density in top view and as spikes protruding from the lipid bilayer in side view. The scale bar corresponds to 50 nm. (C) CTF corrected top view class average of lipid induced ClyA pore assemblies. The scale bar is valid for all averages and corresponds to 5 nm. (DG) Gallery of side view averages of lipid induced ClyA pore complexes. Each average contains between 25 and 140 projections. The different orientations of the particles with respect to the spherical vesicles result in variations of the particle's length in projection (140–150 Å). Each image shows three distinct spots of higher density (marked with bars in (G). (H) Side view average of the detergent induced ClyA complex aligned with respect to the membrane bound pore in (G).
Figure 7
Figure 7
Conformational changes during assembly of ClyAred followed by fluorescence and CD spectroscopy. (A) Fluorescence emission spectra of ClyAred. Spectra of the soluble monomer (in PBS), the monomeric intermediate I1 (in PBS, 0.1% DDM), and oligomeric ClyAred (in PBS, 0.1% DDM) are shown. (B) Kinetics of assembly of ClyAred in DDM monitored by fluorescence. Oligomerization of ClyAred (5 μM) induced by 0.1% DDM was followed at 330 nm (15°C). The line shows the fit of a monoexponential function omitting the first 100 s. The arrow indicates the signal of monomeric ClyAred in PBS at 330 nm. (C) Far-UV CD-spectra of monomeric and oligomeric ClyAred. Spectra of the soluble monomer (in PBS) and oligomeric ClyAred (in PBS, 0.1% DDM) are shown. (D) Kinetics of assembly of ClyAred in detergent and in erythrocyte membranes monitored by far-UV CD. Oligomerization of ClyAred induced by 0.1% DDM (upper panel) or erythrocyte membranes (lower panel) was followed at 225 nm (15°C). The lines show the fit of monoexponential functions omitting the first 100 s. The arrows indicate the signal of monomeric ClyAred in PBS at 225 nm. (E) Proposed mechanism of assembly of ClyA. Monomeric ClyA quickly associates with detergent (upper row) or the membrane (lower row) and undergoes a structural change leading to the monomeric intermediate I1. A second and much slower conversion yields the monomeric and assembly-competent intermediate I2, which rapidly assembles into the oligomeric pore complex. The detergent-induced pore complex (with cap) converts to the membrane-embedded pore complex (without cap) upon detergent removal in the presence of lipids.

References

    1. Atkins A, Wyborn NR, Wallace AJ, Stillman TJ, Black LK, Fielding AB, Hisakado M, Artymiuk PJ, Green J (2000) Structure–function relationships of a novel bacterial toxin, hemolysin E. The role of alpha G. J Biol Chem 275: 41150–41155 - PubMed
    1. Braun M, Silhavy TJ (2002) Imp/OstA is required for cell envelope biogenesis in Escherichia coli. Mol Microbiol 45: 1289–1302 - PubMed
    1. del Castillo FJ, Leal SC, Moreno F, del Castillo I (1997) The Escherichia coli K-12 sheA gene encodes a 34-kDa secreted haemolysin. Mol Microbiol 25: 107–115 - PubMed
    1. del Castillo FJ, Moreno F, del Castillo I (2001) Secretion of the Escherichia coli K-12 SheA hemolysin is independent of its cytolytic activity. FEMS Microbiol Lett 204: 281–285 - PubMed
    1. Choe S, Bennett MJ, Fujii G, Curmi PM, Kantardjieff KA, Collier RJ, Eisenberg D (1992) The crystal structure of diphtheria toxin. Nature 357: 216–222 - PubMed

Publication types

MeSH terms