. 2006 Jun;60(5):1164-78.
doi: 10.1111/j.1365-2958.2006.05175.x.

Fine-scale time-lapse analysis of the biphasic, dynamic behaviour of the two Vibrio cholerae chromosomes

Affiliations
Free PMC article

Fine-scale time-lapse analysis of the biphasic, dynamic behaviour of the two Vibrio cholerae chromosomes

Aretha Fiebig et al. Mol Microbiol. 2006 Jun.
Free PMC article

Abstract

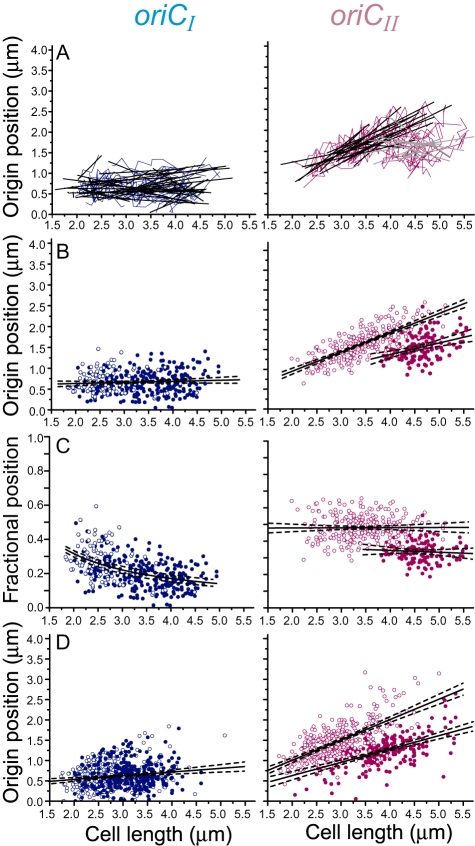
Using fluorescent repressor-operator systems in live cells, we investigated the dynamic behaviour of chromosomal origins in Vibrio cholerae, whose genome is divided between two chromosomes. We have developed a method of analysing fine-scale motion in the curved co-ordinate system of vibrioid bacteria. Using this method, we characterized two different modes of chromosome behaviour corresponding to periods between segregation events and periods of segregation. Between segregation events, the origin positions are not fixed but rather maintained within ellipsoidal caged domains, similar to eukaryotic interphase chromosome territories. These domains are approximately 0.4 microm wide and 0.6 microm long, reflecting greater restriction in the short axis of the cell. During segregation, movement is directionally biased, speed is comparable between origins, and cell growth can account for nearly 20% of the motion observed. Furthermore, the home domain of each origin is positioned by a different mechanism. Specifically, the oriC(I) domain is maintained at a constant actual distance from the pole regardless of cell length, while the oriC(II) domain is maintained at a constant relative position. Thus the actual position of oriC(II) varies with cell length. While the gross behaviours of the two origins are distinct, their fine-scale dynamics are remarkably similar, indicating that both experience similar microenvironments.


Figures

Fig. 1
Fig. 1
Localization patterns of oriCI and oriCII. oriCI exhibits a near-polar localization pattern, while oriCII localizes to the mid-cell or the future mid-cell. oriCI is visualized with LacI-CFP and oriCII is visualized with TetR-YFP. A. Shorter cells have one focus for each origin. B. Mid-sized cells have two foci for oriCI and a single focus for oriCII. C. Longer cells have two copies of each origin. Scale bar in the top left image (A) is 1 µm.
Fig. 2
Fig. 2
Frames of measurement. A. The positions of fluorescent foci (concentric blue circles) were measured based on objectively defined axes in these curved cells. The length of the cell is the sum of short linear segments (delimited by the green dots) along the centre of the bacterium. Red dots indicate the poles. The position of each focus was measured in terms of distance from the centreline (red bracket) and distance from the pole (black bracket). B. Expected line fitting analysis if origins were localized to fixed distances from the pole (i and ii) or fixed relative positions in the cell (iii and iv); see text for further details. In these examples, origins are a maintained at a distance of 0.5 µm from the pole (i and ii) or a relative position of 30% of the cell length (iii and iv).
Fig. 3
Fig. 3
Time-lapse behaviour of both origins visualized with TetR-YFP over the course of 5 min intervals. Both oriCI (A, C, E, G) and oriCII (B, D, F, H) exhibit two behavioural phases corresponding (i) segregation when motion is directionally biased and (ii) periods between segregation events during which the position is not fixed but rather maintained in a ‘home’ domain (see text). Graphs A–D represent the tracks obtained from single cells over the course of about 100 min. The pink ovals represent the cell body at the beginning and end of the time-lapse. The black lines indicate cell length. The perpendicular branches in the black lines designate cell divisions. Arrow indicates an example of a ‘bounce’ at segregation, see text. To enable comparisons between cells, tracks of origin position were plotted versus cell length instead of time (E–H). When cells divided, tracks were subdivided so that each line in E or F represents a track in a single cell cycle. Thirty-two oriCI were tracked in 30 cells and 28 oriCII were tracked in 21 cells. Positions of origins in the home and segregating phases are indicated in G and H, where origin positions measured at each time point are plotted versus cell length without the lines connecting the tracks. A single origin in a cell is indicated by an open circle. Once segregated, origins are indicated by filled circles; those in the segregating phase are green, and those that remained at home, or have reached a new home are blue or red for oriCI and oriCII respectively.
Fig. 5
Fig. 5
Movement of origins is greater in the length axis and is directionally biased in the length axis during the segregating phase. A. The distribution of 20 s step in the length (black squares) and width (red circles) axes fit Gaussian functions (black and red lines) centred around zero, as expected for random motion. The graphs represent 222 and 526 steps for oriCI and oriCII respectively. B and C. The steps over 5 min intervals were analysed separately for the two different phases of motion and the two axes of the cell. In the home phase, steps fit Gaussian distributions centred around zero (black and red indicate length and width axes respectively). In the segregating phase (green), the centre of the step size distribution is shifted from zero in the length (B), but not width (C), axis indicating directional bias in the length axis. oriCI distributions represent 284 and 88 steps in the home and segregating phases respectively. oriCII distributions represent 369 and 59 steps in the home and segregating phases respectively. In both (A) and (B and C) the standard deviation is greater in the length axis than in the width axis, indicating larger steps in the long axis of the cell (see text).
Fig. 4
Fig. 4
Between segregation events, oriCI is positioned at a constant absolute distance from the pole and oriCII is positioned at a constant relative distance from the pole. For analysis of home positioning method, origin tracks from 5 min interval movies were analysed. All oriCI tracks as well as duplicated and segregated oriCII tracks are plotted with the nearest pole at zero. This enables comparison of ‘home’ domains on opposite sides of the cell. Before an observed cell division, the poles are indistinguishable. For measurement of oriCII position, using the nearest pole as zero gives a non-normal distribution of positions (not shown) indicating a bias in measurement. Thus, before observed divisions, single oriCII tracks are plotted with an arbitrary pole at zero; after cell division, the new pole was used as the zero. A. Regression lines for individual origins in the home position (black lines) correspond to the home position tracks as shone in Fig. 3E and F (thin blue or pink lines). The average slope for oriCI is 0.07. The average slope for oriCII is 0.48 when single copy and 0.15 when duplicated. B. Regression analysis of the actual positions of the time-lapse foci taken together as a whole. oriCI fits a line with a slope near zero (y = 0.03x + 0.58) and oriCII fits a line with a slope near 0.5 (y = 0.49x − 0.02) when single copy and near 0.25 (y = 0.29x + 0.21) when segregated. C. The fractional positions of the time-lapse origin versus cell length. oriCI fits a line with the equation y = 0.58x(−0.96) and oriCII fits a line with a slope of zero (y = 0.001x + 0.48) and (y = −0.01x + 0.39) for single and double spots respectively. D. Regression analysis for a population of still images of ∼500 cells yields lines of (y = 0.09x + 0.35) for oriCI and (y = 0.50x + 0.006) and (y = 0.33x − 0.03) for single and double copies of oriCII respectively. These fits are comparable to those in (B) for the origins followed by time-lapse microscopy and confirm that oriCI is positioned at an actual distance from the pole regardless of the number of origins in the cell and oriCII is positioned at a relative position in the cell. Solid lines indicate the fit of the data. Dotted lines represent the 5 and 95% confidence intervals of the fit calculated by Microcal Origin 6.0 (Microcal Software, Northampton, MA). A single origin in a cell is indicated by an open circle. Once segregated, origins are indicated by filled circles.
Fig. 6
Fig. 6
Origins behave subdiffusively and are caged in both axes by 10 min. MSD for time intervals (τ) between 1 and 1500 s are plotted on liner axes (A) and logarithmic axes (B) for both oriCI and oriCII. Displacement in the home phase approaches a horizontal asymptote in both the length (black) and width (red) axes indicating that motion is restricted to a caged domain. In the segregating phase, displacement along the length axis (green squares) is dramatically greater than any movements in the home phase. In (A), note the change in vertical axes. Insets in (A) show expansions of the short-time intervals. In (B), the slopes of MSD versus τ are less than 1 in the home phase revealing subdiffusive behaviour of the origins (dashed line has slope of 1 for comparison). When motion is subdiffusive, the apparent diffusion coefficient is dependent on τ. The apparent diffusion coefficient (MSD/2τ) is plotted as a function of τ for both axes (C). Displacement of oriCI is measured with pole as the frame of reference in the length axis. Displacement of oriCII is measured with the mid-cell as the frame of reference. Error bars represent standard error of the means. These figures represent analysis of 16, 17 and 32 oriCI tracked at 2 s, 20 s and 5 min intervals respectively, and 17, 29 and 28 oriCII tracked at 1 s, 20 s and 5 min intervals respectively.
Fig. 7
Fig. 7
The population distribution of origin positions. Distributions of origin position from either populations of (A) 425 cells each imaged at a single point in time, or (B) the 5 min interval time-lapse data are plotted versus distance from the pole for oriCI and distance from the mid-cell for oriCII. Cells with single origin spots were examined separately from those with two origin spots. For oriCI, the distribution is the same for single and double spots, while for oriCII the relative positions clearly change after duplication and segregation. Curved lines show fits to a Gaussian function. The standard deviation for all curves is 0.3 µm.
Fig. 8
Fig. 8
Relative size and temporal positioning of caged origin domains through the cell cycle. The scaled sizes of the ellipsoidal caging domains are shown on (A) an example cell and (B) a model cell through a cell cycle. The caged domains for oriCI (blue) maintain a constant actual distance from the pole and the caged domains for oriCII (red) maintain a constant relative position in the cell. Green arrows indicate directed movement during the segregating phase, which is asymmetric for oriCI and symmetric for oriCII.

References

    1. Abuladze NK, Gingery M, Tsai J, Eiserling FA. Tail length determination in bacteriophage T4. Virology. 1994;199:301–310. - PubMed
    1. Bates D, Kleckner N. Chromosome and replisome dynamics in E. coli: loss of sister cohesion triggers global chromosome movement and mediates chromosome segregation. Cell. 2005;121:899–911. - PMC - PubMed
    1. Berg HC. Random Walks in Biology. Princeton, NJ: Princeton University Press; 1993.
    1. Ebersbach G, Gerdes K. The double par locus of virulence factor pB171: DNA segregation is correlated with oscillation of ParA. Proc Natl Acad Sci USA. 2001;98:15078–15083. - PMC - PubMed
    1. Ebersbach G, Gerdes K. Bacterial mitosis: partitioning protein ParA oscillates in spiral-shaped structures and positions plasmids at mid-cell. Mol Microbiol. 2004;52:385–398. - PubMed

Publication types

LinkOut - more resources