. 2006 Jul 1;574(Pt 1):229-43.
doi: 10.1113/jphysiol.2005.104042. Epub 2006 May 11.

Hyperpolarization-activated cation channels in fast-spiking interneurons of rat hippocampus

Affiliations

Hyperpolarization-activated cation channels in fast-spiking interneurons of rat hippocampus

Yexica Aponte et al. J Physiol. .

Abstract

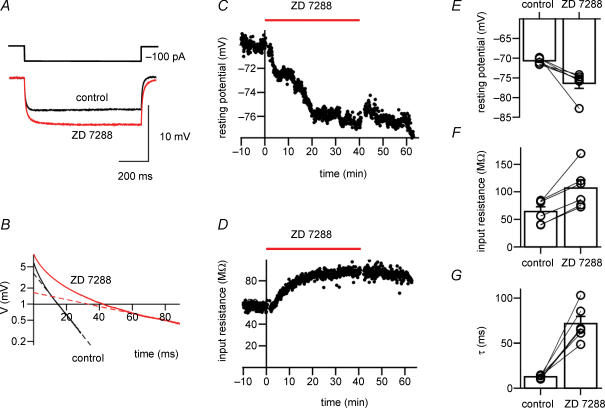
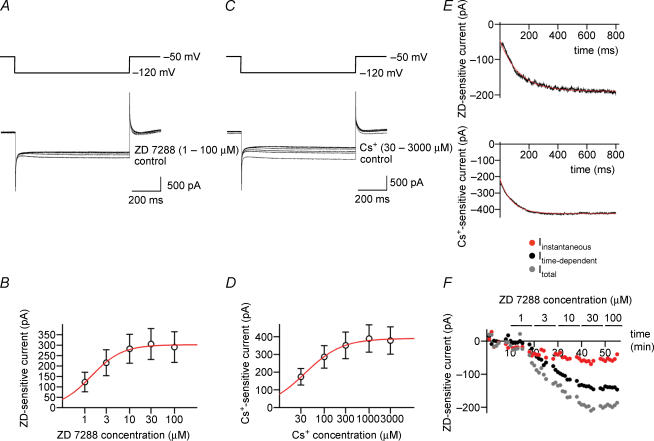
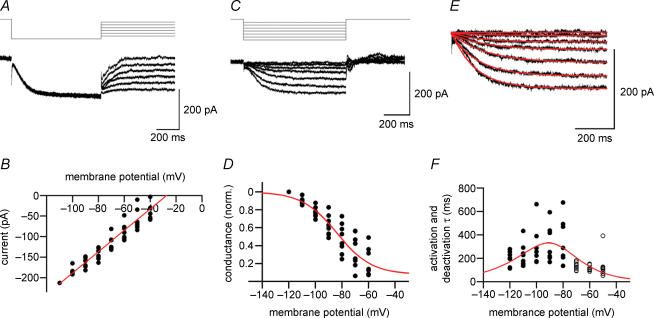
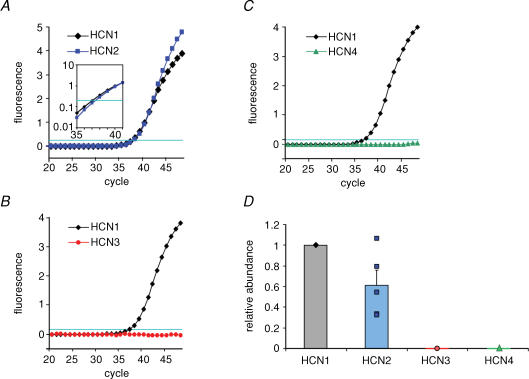
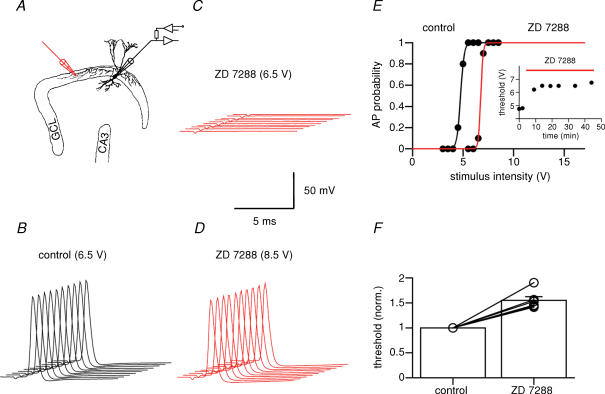
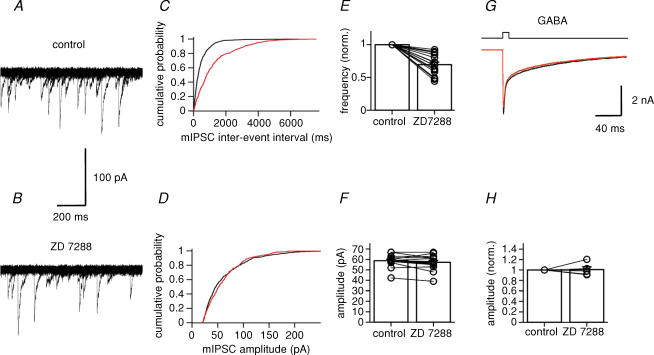
Hyperpolarization-activated channels (Ih or HCN channels) are widely expressed in principal neurons in the central nervous system. However, Ih in inhibitory GABAergic interneurons is less well characterized. We examined the functional properties of Ih in fast-spiking basket cells (BCs) of the dentate gyrus, using hippocampal slices from 17- to 21-day-old rats. Bath application of the Ih channel blocker ZD 7288 at a concentration of 30 microm induced a hyperpolarization of 5.7 +/- 1.5 mV, an increase in input resistance and a correlated increase in apparent membrane time constant. ZD 7288 blocked a hyperpolarization-activated current in a concentration-dependent manner (IC50, 1.4 microm). The effects of ZD 7288 were mimicked by external Cs+. The reversal potential of Ih was -27.4 mV, corresponding to a Na+ to K+ permeability ratio (PNa/PK) of 0.36. The midpoint potential of the activation curve of Ih was -83.9 mV, and the activation time constant at -120 mV was 190 ms. Single-cell expression analysis using reverse transcription followed by quantitative polymerase chain reaction revealed that BCs coexpress HCN1 and HCN2 subunit mRNA, suggesting the formation of heteromeric HCN1/2 channels. ZD 7288 increased the current threshold for evoking antidromic action potentials by extracellular stimulation, consistent with the expression of Ih in BC axons. Finally, ZD 7288 decreased the frequency of miniature inhibitory postsynaptic currents (mIPSCs) in hippocampal granule cells, the main target cells of BCs, to 70 +/- 4% of the control value. In contrast, the amplitude of mIPSCs was unchanged, consistent with the presence of Ih in inhibitory terminals. In conclusion, our results suggest that Ih channels are expressed in the somatodendritic region, axon and presynaptic elements of fast-spiking BCs in the hippocampus.


Figures

Figure 1
Figure 1. ZD 7288 induces hyperpolarization, increases input resistance and prolongs apparent membrane time constant of fast-spiking BCs
A, voltage traces recorded during hyperpolarizing current pulses (−100 pA). Black trace, control; red trace, 30 μm ZD 7288. Average of 50 and 20 sweeps, respectively. The hyperpolarization of the resting membrane potential occurring during application of ZD 7288 was subtracted from the traces. B, corresponding semilogarithmic plot of voltage versus time during −100 pA current pulses. Apparent membrane time constants were measured by plotting voltage differences logarithmically in the range 100% to 5% of the maximal amplitude, and fitting the final 20-ms epoch of each trace by linear regression (dashed lines). Time constants τ were 11.2 ms in control and 66.4 ms in the presence of ZD 7288. C, graph of resting potential versus time during application of 30 μm ZD 7288. D, corresponding graph of input resistance versus time, measured with hyperpolarizing current pulses. Horizontal bars in C and D represent the duration of the application of ZD 7288. Data in A–D are from the same cell. E–G, summary bar graphs of the effects of 30 μm ZD 7288 on resting membrane potential (E), input resistance (F) and apparent membrane time constant (τ) determined by logarithmic fitting (G) in six BCs. Bars represent mean values, circles connected by lines indicate data from the same experiment. In all experiments, 10 μm CNQX, 20 μm d-AP5, and 20 μm BIC were added to the bath solution to block synaptic events.
Figure 2
Figure 2. ZD 7288 affects passive, but not active membrane properties of fast-spiking BCs
A, traces of APs evoked by 2.4 nA, 0.5-ms current pulses. Black trace, control; red trace, 30 μm ZD 7288. The cell was held at −70 mV by holding current adjustment throughout the experiment. B, traces of APs evoked by 800-pA, 800-ms current pulses. Black trace, control; red trace, 30 μm ZD 7288. C–G, summary graphs of the effects of ZD 7288 on maximal rate of rise (C), AP peak amplitude (D), AP duration at half-maximal amplitude (E), fast afterhyperpolarization (AHP) (F) and slow AHP (G). All parameters were measured for single APs evoked by brief current pulses. H, summary graph of the effects of ZD 7288 on maximal AP frequency. Frequency was determined for trains of APs evoked by 800-pA, 800-ms pulses. Bars represent mean values, circles indicate data from individual experiments. Data from 10 BCs. In all experiments, 10 μm CNQX, 20 μm D-AP5 and 20 μm BIC were added to the bath solution.
Figure 3
Figure 3. Both external ZD 7288 and Cs+ block hyperpolarization-activated currents in BCs in a concentration-dependent manner
A, traces of currents activated by hyperpolarizing pulses from a holding potential of −50 mV to a test pulse potential of −120 mV in the presence of different concentrations of ZD 7288 in the bath solution. B, amplitude of the ZD 7288-sensitive current, plotted against ZD 7288 concentration. Data points were fitted with a Hill equation, yielding an IC50 of 1.4 μm and a Hill coefficient of 1.3. Data from nine BCs. C, traces of currents activated by hyperpolarizing pulses from −50 to −120 mV in the presence of different concentrations of Cs+ in the bath solution. D, amplitude of the Cs+-sensitive current, plotted against Cs+ concentration. IC50, 37.4 μm; Hill coefficient, 1.1. Data from five BCs. E, onset time course of ZD 7288-sensitive current (upper trace) and Cs+-sensitive current (lower trace) obtained by digital subtraction of currents in the absence and in the presence of 100 μm ZD 7288 and 3 mm Cs+, respectively. Note instantaneous and time-dependent component. Red curves, fitted exponential functions. F, graph of amplitude of total Ih (grey circles), instantaneous component (red circles) and time-dependent component (black circles) during application of different concentrations of ZD 7288 (horizontal bars). Data in A, E and F are from the same BC. ZD 7288- and Cs+-sensitive currents were isolated by digital subtraction of traces before and after application of different concentrations of ZD 7288 and Cs+, respectively. In all experiments, 1 μm TTX, 3 mm 4-AP, 10 μm CNQX, 20 μm d-AP5 and 20 μm BIC were added to the bath solution.
Figure 4
Figure 4. Ion selectivity and gating properties of hyperpolarization-activated currents in BCs
A, traces of ZD 7288-sensitive currents activated by a hyperpolarizing prepulse to −120 mV, followed by a test pulse to potentials between −110 and −60 mV. Holding potential, −50 mV. B, instantaneous current–voltage relation obtained by plotting the current at the beginning of the test pulse against test pulse potential. Currents were normalized to the value at −110 mV, and remultiplied by the respective mean. Red line obtained by linear regression. Extrapolated reversal potential, −27.4 mV. C, traces of ZD 7288-sensitive currents activated by hyperpolarizing test pulses between −120 and −60 mV. Holding potential, −50 mV. D, Ih channel activation curve. Ih was measured as the total current at the end of the test pulses, converted into conductance, and normalized to the value at −120 mV. Red curve, fitted Boltzmann function (midpoint potential, −83.9 mV; slope, 13.1 mV; voltage-independent component, 0.08). E, traces of Ih at potentials between −120 and −60 mV (protocol as in C). Red curves, fitted exponentials. F, time constants of activation (•) and deactivation (○). Time constants were determined by fitting traces with single exponential functions. Red curve, fitted τ function (see Methods). Data in B, D and F are from eight BCs. ZD 7288-sensitive currents were isolated by digital subtraction of traces before and after application of 30 μm ZD 7288. In all experiments, 1 μm TTX, 3 mm 4-AP, 10 μm CNQX, 20 μm d-AP5 and 20 μm BIC were added to the bath solution.
Figure 5
Figure 5. Single-cell RT-qPCR reveals that BCs coexpress HCN1 and HCN2 subunits
A–C, detection of HCN subunits by RT-qPCR analysis. The mRNA of the material harvested from a single cell was reverse-transcribed, and the resulting cDNA was split into two aliquots to examine the coexpression of two HCN subunits in a given cell. Note that BCs coexpressed HCN1 and HCN2, but lacked detectable expression of HCN3 and HCN4. Inset in A is logarithmic plot of fluorescence between cycle 35 and 41, illustrating a difference in Ct value (i.e. cycle number in which fluorescence reaches an arbitrary threshold of 0.2; horizontal lines in A–C). D, relative abundance of HCN1–4 cDNA in single BCs. For each subunit, relative abundance was quantified as 2Ct, where ΔCt=Ct(HCN2)Ct(HCN1). Data from 11 BCs.
Figure 6
Figure 6. Ih channel block increases the threshold of AP initiation in BC axons
A, schematic illustration of stimulation and recording configuration. A stimulus electrode (monopolar glass pipette) was placed in the granule cell layer (GCL) at a distance of 200–1000 μm from the recorded BC. B–D, 10 consecutive APs in control conditions (B, stimulus intensity 6.5 V), in the presence of 30 μm ZD 7288 at the same stimulus intensity (C), and in the presence of ZD 7288 after increase in stimulation intensity (D, 8.5 V). The somatic resting potential in the recorded BC was maintained at −70 mV by continuous adjustment of the holding current. Traces were right-upwardly shifted against each other for clarity. E, probability of AP initiation plotted against stimulus intensity in control conditions (black) and after application of 30 μm ZD 7288 (red). Note that ZD 7288 increased the threshold for AP initiation. Curves show Boltzmann functions fitted to the data points. Inset shows AP initiation threshold plotted against time during ZD 7288 application for the same cell. F, summary of the effects of ZD 7288 on AP threshold. Data from six BCs. In all experiments, 10 μm CNQX, 20 μm d-AP5 and 20 μm BIC were added to the bath solution to block synaptic events.
Figure 7
Figure 7. Ih channel block reduces the frequency of miniature IPSCs in granule cells
A, 20 consecutive traces of spontaneous mIPSCs recorded in a granule cell at −70 mV under control conditions. B, similar traces after application of 30 μm ZD 7288. For display purposes, recorded traces were digitally filtered at 1 kHz. C, cumulative histograms of mIPSC interevent interval. D, cumulative histograms of mIPSC peak amplitude. Black curves, control; red curves, 30 μm ZD 7288. Data shown in A–D were obtained from the same cell. E and F, summary bar graphs showing the effects of ZD 7288 on mIPSC frequency (normalized to control values, E) and amplitude (F). Left bar, control; right bar, 30 μm ZD 7288. Data from 15 granule cells. Bars represent mean values, circles represent data from individual experiments. In all experiments, 1 μm TTX, 10 μm CNQX and 20 μm d-AP5 were added to the bath solution. G, currents activated by fast application of 1 mm GABA (10-ms pulse) to a nucleated patch isolated from a granule cell. Holding potential, −50 mV. Black trace, control (pulse from Na+-rich solution to Na+-rich solution + 1 mm GABA); red trace, 30 μm ZD 7288 (pulse from Na+-rich solution + 30 μm ZD 7288 to Na+-rich solution + 30 μm ZD 7288 + 1 mm GABA). Each trace is the average of 20 single sweeps. H, summary bar graph showing the lack of effects of ZD 7288 on GABA-activated currents (n = 5 patches).

Comment in

References

    1. Awatramani GB, Price GD, Trussell LO. Modulation of transmitter release by presynaptic resting potential and background calcium levels. Neuron. 2005;48:109–121. - PubMed
    1. Baker M, Bostock H, Grafe P, Martius P. Function and distribution of three types of rectifying channel in rat spinal root myelinated axons. J Physiol. 1987;383:45–67. - PMC - PubMed
    1. Bartos M, Vida I, Frotscher M, Meyer A, Monyer H, Geiger JRP, Jonas P. Fast synaptic inhibition promotes synchronized gamma oscillations in hippocampal interneuron networks. Proc Natl Acad Sci U S A. 2002;99:13222–13227. - PMC - PubMed
    1. Beaumont V, Zucker RS. Enhancement of synaptic transmission by cyclic AMP modulation of presynaptic Ih channels. Nat Neurosci. 2000;3:133–141. - PubMed
    1. Buhl EH, Halasy K, Somogyi P. Diverse sources of hippocampal unitary inhibitory postsynaptic potentials and the number of synaptic release sites. Nature. 1994;368:823–828. - PubMed

Publication types

MeSH terms

Substances

LinkOut - more resources