

Impaired performance in commercial drivers: role of sleep apnea and short sleep duration
- PMID: 16690976
- PMCID: PMC2648121
- DOI: 10.1164/rccm.200408-1146OC
Impaired performance in commercial drivers: role of sleep apnea and short sleep duration
Abstract
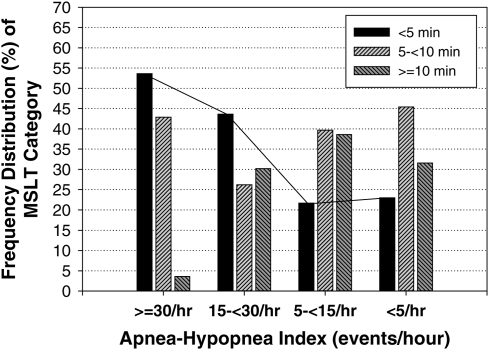
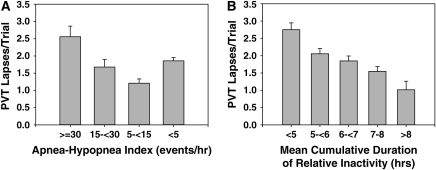
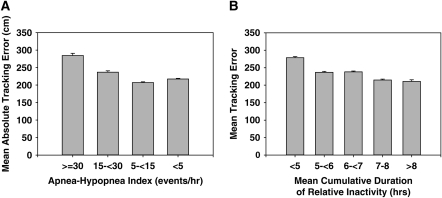
Sleepiness plays an important role in major crashes of commercial vehicles. Because determinants are likely to include inadequate sleep and sleep apnea, we evaluated the role of short sleep durations over 1 wk at home and sleep apnea in subjective sleepiness (Epworth Sleepiness Scale), objective sleepiness (reduced sleep latency as determined by the Multiple Sleep Latency Test), and neurobehavioral functioning (lapses in performance, tracking error in Divided Attention Driving Task) in commercial drivers. Studies were conducted in 247 of 551 drivers at higher risk for apnea and in 159 of 778 drivers at lower risk. A multivariate linear association between the sets of outcomes and risk factors was confirmed (p < 0.0001). Increases in subjective sleepiness were associated with shorter sleep durations but not with increases in severity of apnea. Increases in objective sleepiness and performance lapses, as well as poorer lane tracking, were associated with shorter sleep durations. Associations with sleep apnea severity were not as robust and not strictly monotonic. A significant linear association with sleep apnea was demonstrated only for reduced sleep latency. The effects of severe apnea (apnea-hypopnea index, at least 30 episodes/h), which occurred in 4.7%, and of sleep duration less than 5 h/night, which occurred in 13.5%, were similar in terms of their impact on objective sleepiness. Thus, addressing impairment in commercial drivers requires addressing both insufficient sleep and sleep apnea, the former being more common.
Figures


References
-
- Center for National Trucking Statistics. THA facts 1999. Ann Arbor, MI: University of Michigan Transportation Research Institute; 2000.
-
- National Transportation Safety Board. Factors that affect fatigue in heavy truck accidents. Vol. 1: Analysis safety study. Washington, DC: National Transportation Safety Board; 1995.
-
- AAA Foundation for Traffic Safety. A report on the determination and evaluation of the role of fatigue in heavy truck accidents. Washington, DC: AAA Foundation for Traffic Safety; 1995.
-
- Dinges DF, Pack F, Williams K, Gillen KA, Powell JW, Ott GE, Aptowicz C, Pack AI. Cumulative sleepiness, mood disturbance, and psychomotor vigilance performance decrements during a week of sleep restricted to 4–5 hours per night. Sleep 1997;20:267–277. - PubMed
-
- Belenky G, Wesensten NJ, Thorne DR, Thomas ML, Sing HC, Redmond DP, Russo MB, Balkin TJ. Patterns of performance degradation and restoration during sleep restriction and subsequent recovery: a sleep dose–response study. J Sleep Res 2003;12:1–12. - PubMed
Publication types
MeSH terms
Grants and funding
LinkOut - more resources
Full Text Sources
Other Literature Sources
Medical
