. 2006 Jun;116(6):1494-505.
doi: 10.1172/JCI26498. Epub 2006 May 11.

MCP-1 contributes to macrophage infiltration into adipose tissue, insulin resistance, and hepatic steatosis in obesity

Affiliations

MCP-1 contributes to macrophage infiltration into adipose tissue, insulin resistance, and hepatic steatosis in obesity

Hajime Kanda et al. J Clin Invest. 2006 Jun.

Abstract

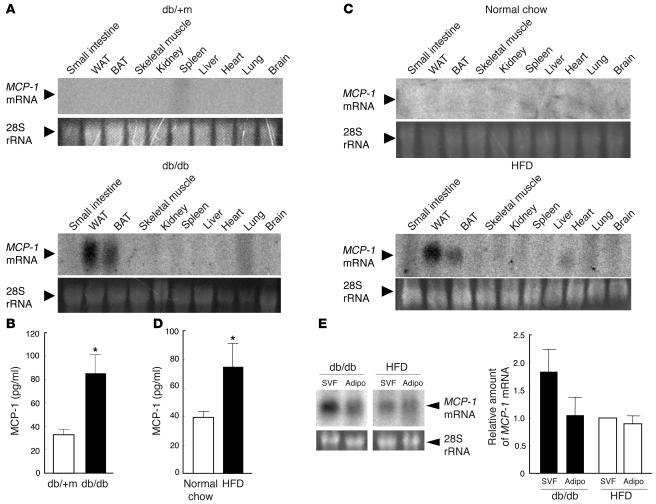
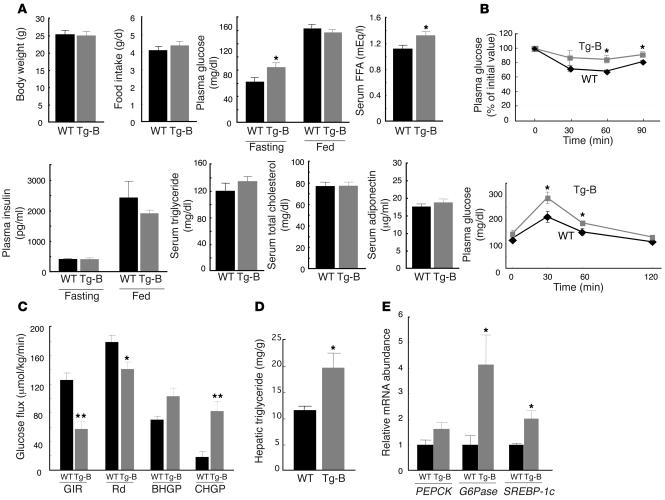
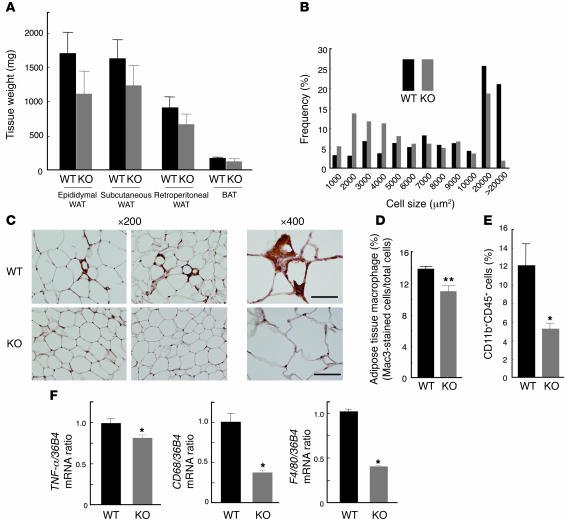
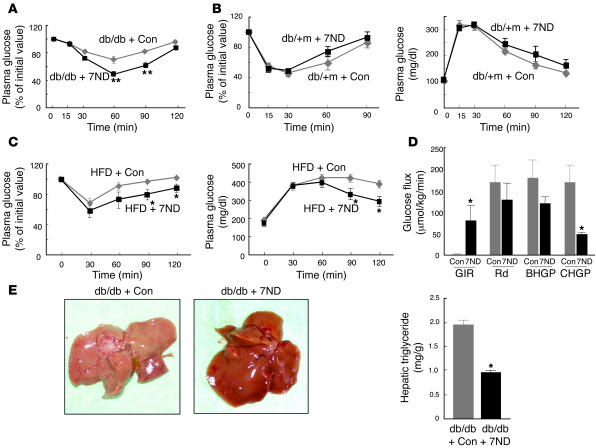
Adipocytes secrete a variety of bioactive molecules that affect the insulin sensitivity of other tissues. We now show that the abundance of monocyte chemoattractant protein-1 (MCP-1) mRNA in adipose tissue and the plasma concentration of MCP-1 were increased both in genetically obese diabetic (db/db) mice and in WT mice with obesity induced by a high-fat diet. Mice engineered to express an MCP-1 transgene in adipose tissue under the control of the aP2 gene promoter exhibited insulin resistance, macrophage infiltration into adipose tissue, and increased hepatic triglyceride content. Furthermore, insulin resistance, hepatic steatosis, and macrophage accumulation in adipose tissue induced by a high-fat diet were reduced extensively in MCP-1 homozygous KO mice compared with WT animals. Finally, acute expression of a dominant-negative mutant of MCP-1 ameliorated insulin resistance in db/db mice and in WT mice fed a high-fat diet. These findings suggest that an increase in MCP-1 expression in adipose tissue contributes to the macrophage infiltration into this tissue, insulin resistance, and hepatic steatosis associated with obesity in mice.


Figures

Figure 1
Figure 1. Upregulation of MCP-1 expression in 3T3-L1 adipocytes by glucose deprivation.
(A) Total RNA (15 μg) extracted from 3T3-L1 adipocytes cultured with or without glucose for 36 hours was subjected to Northern blot analysis with a probe specific for mouse MCP-1 mRNA. The region of the ethidium bromide–stained gel containing 28S rRNA is also shown. (B) The culture supernatants of 3T3-L1 adipocytes cultured with or without glucose for 36 hours were assayed for MCP-1. Data are mean ± SEM (n = 18). *P < 0.01 versus culture with glucose.
Figure 2
Figure 2. Tissue distribution of MCP-1 mRNA and plasma concentration of MCP-1 in obese mice.
(A) Total RNA was extracted from the indicated tissues of 8-week-old db/db or db/+m mice and subjected to Northern blot analysis with a probe specific for mouse MCP-1 mRNA. WAT, white adipose tissue; BAT, brown adipose tissue. (B) Plasma concentration of MCP-1 in 11-week-old db/+m and db/db mice. Data are mean ± SEM (db/+m, n = 8; db/db, n = 11). *P < 0.05 versus db/+m. (C) Total RNA, extracted from the indicated tissues of 18-week-old C57BL/6J mice fed either a high-fat diet (HFD) or normal chow for 12 weeks, was subjected to Northern blot analysis with a probe specific for MCP-1 mRNA. (D) Plasma concentration of MCP-1 in 18-week-old C57BL/6J mice fed normal chow or the high-fat diet for 12 weeks. Data are mean ± SEM (normal chow, n = 11; high-fat diet, n = 9). *P < 0.05 versus normal chow. (E) Total RNA (15 μg), extracted from the SVF and adipocyte fraction (Adipo) of epididymal fat tissue from 11-week-old db/db mice or 18-week-old C57BL/6J mice fed a high-fat diet for 12 weeks, was subjected to Northern blot analysis with a probe specific for MCP-1 mRNA. The intensity of the band corresponding to MCP-1 mRNA in each fraction was quantitated and expressed relative to the value for the SVF of mice fed a high-fat diet. Data are mean ± SEM of values from 3 independent experiments (n = 3).
Figure 3
Figure 3. Generation and characterization of transgenic mice that overexpress MCP-1 in adipose tissue.
(A) Northern blot analysis with an MCP-1 probe of total RNA isolated from various tissues of 11-week-old MCP-1 Tg-B mice. (B) Plasma concentration of MCP-1 in 13-week-old MCP-1 Tg-B and WT mice. Data are mean ± SEM (n = 7). (C) Immunohistochemical detection of Mac3 in epididymal adipose tissue of 11-week-old MCP-1 Tg-B and WT mice. Macrophages are stained brown. Magnification, ×200 and ×400, as indicated. Scale bars: 50 μm. (D) Macrophage infiltration into epididymal fat tissue was quantitated in MCP-1 Tg-B (n = 7) and WT mice (n = 9) as the ratio of Mac3-positive cells to total cells. Data are mean ± SEM. (E) Quantitation by flow cytometry of the proportion of CD11b+CD45+ cells (macrophages) in the SVF of epididymal fat tissue from 14-week-old MCP-1 Tg-B (n = 7) and WT mice (n = 6). Data are mean ± SEM. (F) Quantitative RT-PCR analysis of total RNA isolated from epididymal fat tissue of 11-week-old MCP-1 Tg-B and WT mice for TNF-α, CD68, and F4/80 mRNAs. Data (mean ± SEM; n = 4) were normalized by the amount of 36B4 mRNA and expressed relative to the corresponding WT value. *P < 0.05, **P < 0.01 versus WT.
Figure 4
Figure 4. Metabolic characteristics of MCP-1 transgenic mice.
(A) Metabolic parameters of 11-week-old MCP-1 Tg-B and WT mice. Data are means ± SEM (body weight, n = 5; food intake, n = 3 [WT], 4 [Tg-B]; plasma glucose, n = 9 [WT], 11 [Tg-B]; serum FFA, n = 9 [WT], 11 [Tg-B]; plasma insulin, n = 5; serum triglyceride, n = 4 [WT], 6 [Tg-B]; serum total cholesterol, n = 9 [WT], 11 [Tg-B]; serum adiponectin, n = 5). (B) Plasma glucose level during insulin (upper panel) and glucose (lower panel) tolerance tests in WT and MCP-1 Tg-B mice at 12 to 13 weeks of age. Data are mean ± SEM (n = 5). (C) Hyperinsulinemic-euglycemic clamp analysis in MCP-1 Tg-B (n = 5) and WT (n = 7) mice. Data are mean ± SEM. GIR, glucose infusion rate; Rd, rate of glucose disappearance; BHGP, basal hepatic glucose production; CHGP, hepatic glucose production during clamp. (D) Hepatic triglyceride content of 11-week-old MCP-1 Tg-B and WT mice. Data are mean ± SEM (n = 5). (E) Quantitation by Northern blot of the abundance of PEPCK, G6Pase, and SREBP-1c mRNAs in the liver of MCP-1 Tg-B and WT mice after hyperinsulinemic-euglycemic clamp analysis. Data (mean ± SEM; PEPCK and SREBP-1c, n = 5 [WT], 4 [Tg-B]; G6Pase, n = 5.) are expressed relative to the corresponding value for WT mice. *P < 0.05, **P < 0.01 versus WT.
Figure 5
Figure 5. Characterization of adipose tissue of MCP-1 homozygous KO mice fed a high-fat diet.
(A) Weight of various white and brown adipose tissues from the KO and WT mice fed a high-fat diet from 12 to 24 weeks of age. Data are mean ± SEM (n = 5). (B) Size distribution of adipocytes in epididymal fat tissue of mice fed a high-fat diet from 12 to 24 weeks of age. Data are means from analysis of 5 sections from each of 5 mice. (C) Immunohistochemical detection of Mac3 in epididymal adipose tissue of mice fed a high-fat diet from 12 to 24 weeks of age. Magnification, ×200 and ×400, as indicated. Scale bars: 50 μm. (D) Macrophage infiltration into epididymal fat tissue. Data are mean ± SEM (WT, n = 8; KO, n = 6). (E) Quantitation by flow cytometry of the proportion of macrophages in the SVF of epididymal fat tissue from mice fed a high-fat diet from 12 to 28 weeks of age. Data are mean ± SEM (WT, n = 4; KO, n = 6). (F) Abundance of macrophage-related protein mRNAs in epididymal fat tissue of mice fed a high-fat diet from 12 to 24 weeks of age. Data (mean ± SEM; n = 4) were normalized by the amount of 36B4 mRNA and expressed relative to the corresponding WT value. *P < 0.05, **P < 0.01 versus WT.
Figure 6
Figure 6. Metabolic characteristics of MCP-1 KO mice fed a high-fat diet.
(A) Metabolic parameters of mice fed a high-fat diet from 12 to 24 weeks of age. Data are means ± SEM (body weight, n = 5 [WT], 9 [KO]; food intake, n = 4; plasma glucose, n = 5; serum FFA, n = 6 [WT], 5 [KO]; plasma insulin, n = 7 [WT], 6 [KO]; serum triglyceride, n = 7 [WT], 6 [KO]; serum total cholesterol, n = 6 [WT], 5 [KO]; serum adiponectin, n = 7 [WT], 5 [KO]). (B) Plasma glucose level during insulin (upper panel) and glucose (lower panel) tolerance tests in mice fed a high-fat diet from 12 to 24 weeks of age. Data are mean ± SEM (n = 6). (C) Hyperinsulinemic-euglycemic clamp analysis in mice fed a high-fat diet from 12 to 28 weeks of age. Data are mean ± SEM (WT, n = 6; KO, n = 5). (D) Hepatic triglyceride content of mice fed a high-fat diet from 12 to 28 weeks of age. Data are mean ± SEM (n = 5). (E) Quantitation by Northern blot of the hepatic abundance of PEPCK, G6Pase, and SREBP-1c mRNAs in mice after hyperinsulinemic-euglycemic clamp analysis. Data (mean ± SEM; n = 5) were expressed relative to the corresponding WT value. *P < 0.05, **P < 0.01 versus WT.
Figure 7
Figure 7. Effects of expression of the MCP-1 mutant 7ND on insulin sensitivity in obese mice.
(A) Insulin tolerance test in db/db mice determined insulin sensitivity 21 days after transfection of 8-week-old animals with the 7ND vector (n = 10) or the corresponding empty plasmid as a control (Con, n = 6). (B) Insulin (left) and glucose (right) tolerance tests performed 21 days after transfection of 8-week-old db/+m mice with the 7ND vector (n = 8) or the corresponding empty plasmid (n = 7). (C) Insulin (left) and glucose (right) tolerance tests performed 21 days after transfection of 30-week-old C57BL/6J mice fed a high-fat diet since 6 weeks of age with either the 7ND expression vector or the corresponding empty plasmid. Data are mean ± SEM (insulin tolerance test, n = 4; glucose tolerance test, n = 5 [7ND], 7 [empty vector]). (D) Hyperinsulinemic-euglycemic clamp analysis of db/db mice performed 21 days after transfection of 8-week-old animals with the 7ND vector (n = 4) or the corresponding empty plasmid (n = 5). Data are mean ± SEM. (E) Appearance of the liver (left) and hepatic triglyceride content (n = 4, right) in db/db mice 21 days after injection of 8-week-old animals with the 7ND expression plasmid or the corresponding empty vector. *P < 0.05, **P < 0.01 versus mice injected with the empty vector.

References

    1. Spiegelman B.M., Flier J.S. Obesity and the regulation of energy balance. Cell. 2001;104:531–543. - PubMed
    1. Kahn B.B., Flier J.S. Obesity and insulin resistance. J. Clin. Invest. 2001;106:473–481. - PMC - PubMed
    1. Ahima R.S., Flier J.S. Adipose tissue as an endocrine organ. Trends Endocrinol. Metab. 2000;11:327–332. - PubMed
    1. Yoshimura T., et al. Purification and amino acid analysis of two human glioma-derived monocyte chemoattractants. J. Exp. Med. 1989;169:1449–1459. - PMC - PubMed
    1. Matsushima K., Larsen C.G., DuBois G.C., Oppenheim J.J. Purification and characterization of a novel monocyte chemotactic and activating factor produced by a human myelomonocytic cell line. J. Exp. Med. 1989;169:1485–1490. - PMC - PubMed

Publication types

MeSH terms