. 2006 Jun;97(5):1456-66.
doi: 10.1111/j.1471-4159.2006.03837.x.

Molecular morphology and toxicity of cytoplasmic prion protein aggregates in neuronal and non-neuronal cells

Affiliations

Molecular morphology and toxicity of cytoplasmic prion protein aggregates in neuronal and non-neuronal cells

Catherine Grenier et al. J Neurochem. 2006 Jun.

Abstract

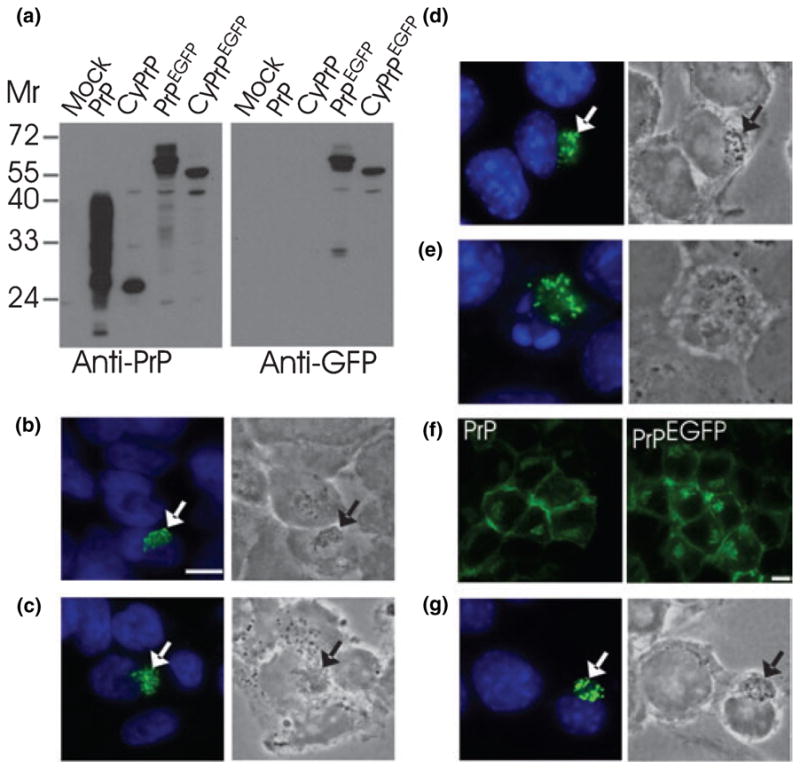
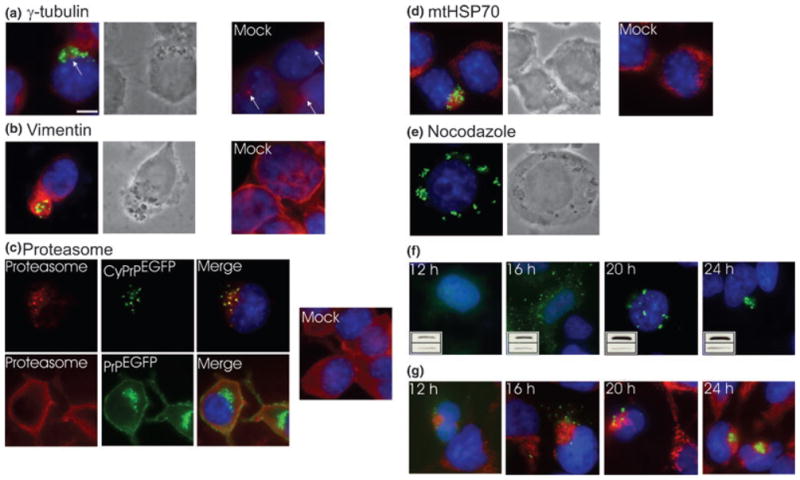
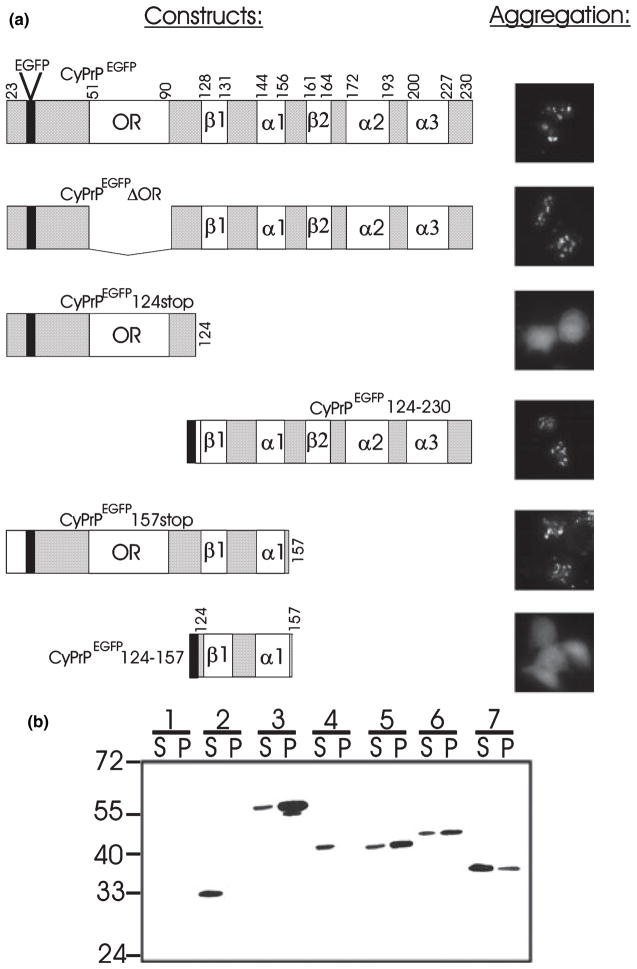
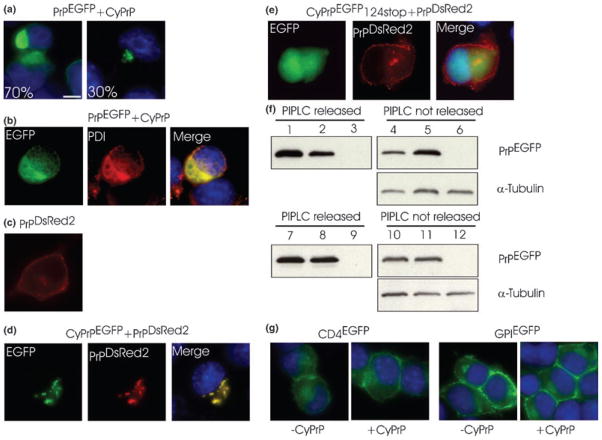
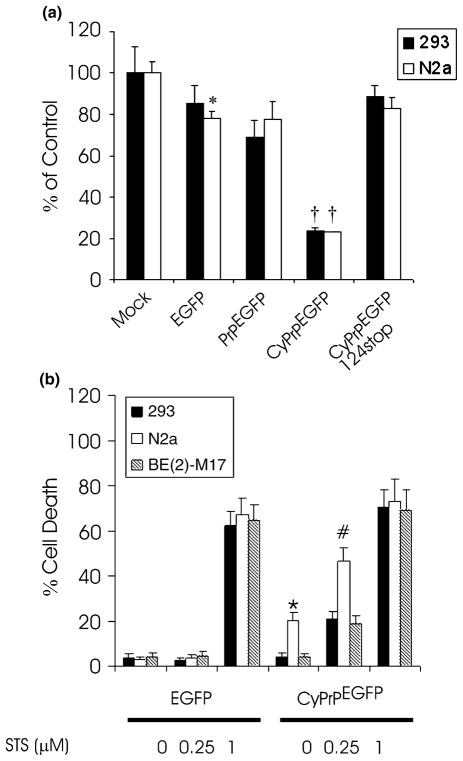
Recent studies have revealed that accumulation of prion protein (PrP) in the cytoplasm results in the production of aggregates that are insoluble in non-ionic detergents and partially resistant to proteinase K. Transgenic mice expressing PrP in the cytoplasm develop severe ataxia with cerebellar degeneration and gliosis, suggesting that cytoplasmic PrP may play a role in the pathogenesis of prion diseases. The mechanism of cytoplasmic PrP neurotoxicity is not known. In this report, we determined the molecular morphology of cytoplasmic PrP aggregates by immunofluorescence and electron microscopy, in neuronal and non-neuronal cells. Transient expression of cytoplasmic PrP produced juxtanuclear aggregates reminiscent of aggresomes in human embryonic kidney 293 cells, human neuroblastoma BE2-M17 cells and mouse neuroblastoma N2a cells. Time course studies revealed that discrete aggregates form first throughout the cytoplasm, and then coalesce to form an aggresome. Aggresomes containing cytoplasmic PrP were 1-5-microm inclusion bodies and were filled with electron-dense particles. Cytoplasmic PrP aggregates induced mitochondrial clustering, reorganization of intermediate filaments, prevented the secretion of wild-type PrP molecules and diverted these molecules to the cytoplasm. Cytoplasmic PrP decreased the viability of neuronal and non-neuronal cells. We conclude that any event leading to accumulation of PrP in the cytoplasm is likely to result in cell death.


Figures

Fig. 1
Fig. 1
CyPrP forms aggresomes in transiently transfected non-neuronal and neuronal cells. (a) Western blot of PrP and EGFP in protein extracts (100 μg protein) from HEK293 cells expressing constructs indicated above the blots. Molecular masses (Mr) are indicated. Expected molecular masses are 27–40 for PrP, 27 for CyPrP, 54–67 for PrPEGFP and 54 for CyPrPEGFP. (b–d) HEK293 (b), BE(2)-M17 (c) and N2a (d) cells were transfected with CyPrP. PrP distribution was examined by immunofluorescence (3F4 mAb, green; left panels). Right panels show corresponding phase-contrast images. Nuclei were stained with Hoechst. The green and blue channels are shown merged. Arrows indicate juxtanuclear aggregates. Scale bar 10 μm. Original magnification × 100. (e) Some 15–20% of N2a cells expressing CyPrP underwent apoptosis. Apoptosis was assessed by nuclei fragmentation. (f) N2a cells were transfected with PrP or PrPEGFP, and examined by immunofluorescence with 3F4 mAb (left panel) or fluorescence of EGFP (right panel). (g) N2a cells were transfected with CyPrPEGFP and examined by fluorescence of EGFP.
Fig. 2
Fig. 2
Characterization of PrP aggregates in N2a cells. (a–d) Immunofluorescence analysis of (a) γ-tubulin, (b) vimentin, (c) proteasome and (d) mtHSP70 (red channel) in cells transfected with CyPrPEGFP (green channel). Nuclei were stained with Hoechst (blue channel). Left panels represent an overlay of the three channels and phase-contrast images of cells transfected with CyPrPEGFP (a, b, d). Right panels represent mock-transfected cells (a–d). Arrow in (a) indicates the centrosome. (e) Distribution of CyPrPEGFP aggregates in cells incubated for 12 h in the presence of nocodazole (10 μg/mL). Left panel is an overlay of the green and blue channels and right panel shows phase-contrast image. (f) Aggregate distribution at different times after transfection determined by direct fluorescence of CyPrPEGFP. Insets show western blot analysis of CyPrPEGFP (upper blot). Equal loading was verified by western blot analysis of α-tubulin (lower blot). (g) Mitochondrial network at different times after transfection. Panels represent an overlay of the green (CyPrPEGFP), red (mtHSP70) and blue (Hoechst) channels. Scale bar 10 μm. Original magnification × 100. Similar results were obtained in HEK293 and BE(2)-M17 cells (not shown).
Fig. 3
Fig. 3
Transmission electron microscopy of CyPrP aggregates. N2a cells were transiently transfected with CyPrP and processed for electron microscopy. (a, b) Electron-dense particles in CyPrP-expressing cells at 16 h (a) and 24 h (b) after transfection. (c) Higher magnification of section indicated by white box in (b) showing mitochondria clustering around an aggresome. (d) Mock-transfected cells. n, nucleus; m, mitochondria. Scale bar 500 nm.
Fig. 4
Fig. 4
The aggregation determinant of CyPrP includes β-sheet 1 and α-helix 1. (a) Diagrams of the of CyPrPEGFP and several deletion mutants engineered in this study are shown. Numbers indicate residues at the junction of different structural domains (adapted from Zahn et al. 2000). The black box represents the EGFP coding sequence. Aggregation was evaluated by fluorescence microscopy of transiently transfected N2a cells (original magnification ×40). (b) Western blot analysis of the constructs described in (a); extracts containing 100 μg protein from N2a cells were immunostained using antibodies directed against EGFP; mock-transfected cells (lanes 1), CyP-rPEGFP (lanes 2, expected Mr 54), CyP-rPEGFPΔOR (lanes 3, expected Mr 49.5), CyPrPEGFP124stop (lanes 4, expected Mr 38, CyPrPEGFP124–230 (lanes 5, expected Mr 39), CyPrPEGFP157stop (lanes 6, expected Mr 42) and CyPrPEGFP124–157 (lanes 7, expected Mr 33.5). Mr values are indicated on the left. S, supernatant; P, pellet.
Fig. 5
Fig. 5
CyPrP aggregates prevent the secretion of wild-type PrP molecules. (a, b) N2a cells were co-transfected with PrPEGFP and CyPrP. Cells were analyzed by direct fluorescence of EGFP (a; numbers indicate percentage of cells with the same pattern of EGFP fluorescence) or immunostained with PDI antibodies (b). (c) Expression and localization of PrPDsRed2 in N2a cells determined by direct fluorescence of DsRed2. (d) N2a cells were co-transfected with PrPDsRed2 and CyPrPEGFP. (e) N2a cells were co-transfected with PrPDsRed2 and CyPrPEGFP124stop. (f) Western blot analysis of PrPEGFP in the supernatant (lanes 1–3) or in the pellet (lanes 4–6) of N2a cells expressing PrPEGFP (lanes 1 and 4), N2a cells expressing PrPEGFP and CyPrP (lanes 2 and 5), or mock-transfected N2a cells (lanes 3 and 6) after treatment with PIPLC. Protein extracts were further treated with peptide N-glycosidase F. Equal loading in fractions from the cell pellet was verified by western blot analysis of α-tubulin. (g) N2a cells were transfected with CD4EGFP, CD4EGFP and CyPrP, GPIEGFP, or GPIEGFP and CyPrP. Scale bar 10 μm. Original magnification ×100. Similar results were obtained with HEK293 cells (not shown).
Fig. 6
Fig. 6
Toxicity of CyPrP aggregates. (a) Cell proliferation of HEK293 and N2a cells transfected with EGFP, PrPEGFP, CyPrPEGFP or CyP-rPEGFP124stop. Activities are expressed as a percentage of the WST-1 metabolizing activity of mock-transfected cells. Values are mean ± SD of three independent experiments. Activity in EGFP-expressing N2a cells was significantly different from that in mock-transfected N2a cells (*p < 0.05). Activity in PrPEGFP-expressing HEK293 and N2a cells was not significantly different from that in EGFP-transfected cells. Activity in CyPrPEGFP-expressing HEK293 and N2a cells was significantly different from that in mock-transfected cells, EGFP-expressing cells and PrPEGFP-expressing cells (†p < 0.01). (b) Cells producing CyPrP aggresomes were more sensitive to STS-induced apoptosis. Cells were transfected with CyP-rPEGFP. Twenty-four hours after transfection, cells were treated with STS at the indicated concentrations for 6 h. The percentage cell death was determined by examining condensed chromatin and fragmented nuclei with Hoechst staining. Values are mean ± SD of three independent experiments. More than 200 cells were counted for each condition. In the absence of STS, cell death in CyPrPEGFP-expressing N2a cells was significantly different from that in CyPrPEGFP-expressing HEK293 and BE(2)-M17 cells (*p < 0.01). Cell death in CyPrPEGFP-expressing N2a cells treated with 0.25 μM STS was significantly different from that in CyPrPEGFP-expressing HEK293 and BE(2)-M17 cells treated with 0.25 μM STS (# p < 0.05). Statistical significance was determined by ANOVA followed by post-hoc Scheffe’s analysis.

References

    1. Bounhar Y, Zhang Y, Goodyer CG, LeBlanc A. Prion protein protects human neurons against Bax-mediated apoptosis. J Biol Chem. 2001;276:39145–39149. - PubMed
    1. Brandner S, Isenmann S, Raeber A, Fischer M, Sailer A, Kobayashi Y, Marino S, Weissmann C, Aguzzi A. Normal host prion protein necessary for scrapie-induced neurotoxicity. Nature. 1996;379:339–343. - PubMed
    1. Cohen E, Taraboulos A. Scrapie-like prion protein accumulates in aggresomes of cyclosporin A-treated cells. EMBO J. 2003;22:404–417. - PMC - PubMed
    1. Debure L, Vayssiere JL, Rincheval V, Loison F, Le Drean Y, Michel D. Intracellular clusterin causes juxtanuclear aggregate formation and mitochondrial alteration. J Cell Sci. 2003;116:3109–3121. - PubMed
    1. Drisaldi B, Stewart RS, Adles C, Stewart LR, Quaglio E, Biasini E, Fioriti L, Chiesa R, Harris DA. Mutant PrP is delayed in its exit from the endoplasmic reticulum, but neither wild-type nor mutant PrP undergoes retrotranslocation prior to proteasomal degradation. J Biol Chem. 2003;278:21732–21743. - PubMed

Publication types

MeSH terms

Grants and funding