. 2006 Aug 1;91(3):882-91.
doi: 10.1529/biophysj.106.083816. Epub 2006 May 12.

Minor groove deformability of DNA: a molecular dynamics free energy simulation study

Affiliations

Minor groove deformability of DNA: a molecular dynamics free energy simulation study

Martin Zacharias. Biophys J. .

Abstract

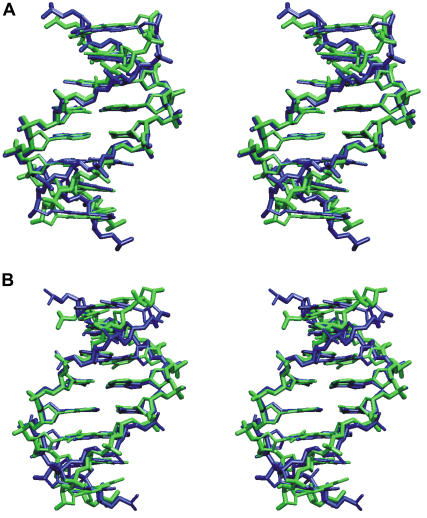
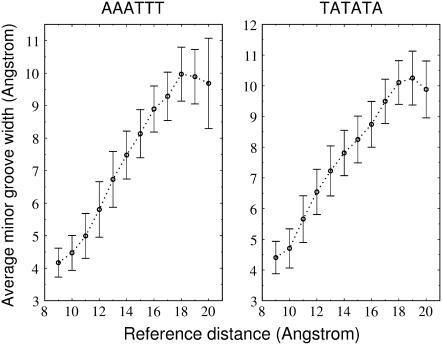
The conformational deformability of nucleic acids can influence their function and recognition by proteins. A class of DNA binding proteins including the TATA box binding protein binds to the DNA minor groove, resulting in an opening of the minor groove and DNA bending toward the major groove. Explicit solvent molecular dynamics simulations in combination with the umbrella sampling approach have been performed to investigate the molecular mechanism of DNA minor groove deformations and the indirect energetic contribution to protein binding. As a reaction coordinate, the distance between backbone segments on opposite strands was used. The resulting deformed structures showed close agreement with experimental DNA structures in complex with minor groove-binding proteins. The calculated free energy of minor groove deformation was approximately 4-6 kcal mol(-1) in the case of a central TATATA sequence. A smaller equilibrium minor groove width and more restricted minor groove mobility was found for the central AAATTT and also a significantly ( approximately 2 times) larger free energy change for opening the minor groove. The helical parameter analysis of trajectories indicates that an easier partial unstacking of a central TA versus AT basepair step is a likely reason for the larger groove flexibility of the central TATATA case.


Figures

FIGURE 1
FIGURE 1
Snapshots of deformed DNA molecules (central TATATA case) during MD simulations at three different interstrand target distances. The view is along the central part of the minor groove (van der Waals representation using a heavy atom color code excluding hydrogen atoms). The groups on both strands that determine the center-of-mass distances are encircled. The atoms that formed the two groups consisted of P, O5′, C5′, C4′, C3′, O3′ (of nucleotide 8), and P, O5′ (of nucleotide 9) on both strands (see Materials and Methods). dref = 10.0 Å represents approximately the DNA equilibrium minor groove width, whereas dref = 18.0 Å corresponds to a conformation close to the DNA in complex with minor groove-binding proteins.
FIGURE 2
FIGURE 2
(A) Superposition (nucleic acid backbone) of experimental purR-DNA (green, central 12 bp, pdb2pub, (8)) onto deformed DNA with central TATATA sequence (blue, dref = 18 Å). (B) Superposition of a snapshot of the deformed TATATA structure (blue, dref = 18 Å) onto experimental TATA box structure from a complex with the TBP protein (pdb1TGH, nucleotides 101–106/119–124 superimposed on central 6 basepairs of the TATATA structure). For clarity, only heavy atoms are shown.
FIGURE 3
FIGURE 3
Calculated potential of mean force for the minor groove deformation of the DNA molecule with central AAATTT (bold lines) and TATATA (thin lines) sequence. The minor groove width is controlled by the reference distances (dref) between backbone segments on opposite strands (see Materials and Methods). Red, green, and black curves correspond to PMF obtained after 1-, 2-, and 3-ns data gathering time per dref. The dashed curves indicate the PMF for the backward simulations starting from dref = 19 Å.
FIGURE 4
FIGURE 4
View into the minor groove (stick model) of the central AAATTT structure (A) and central TATATA structure (B), respectively, at small reference distance (dref = 9 Å). The double arrow indicates the free space available in the case of the AAATTT structure that allows easy propeller twisting at the central basepair step to further reduce the minor groove size. Contrarily, the cross-stacking arrangement of the two adenine bases at the central basepair step in the TATATA structure (double arrow in B) largely prevents propeller twisting as a possibility to further reduce the minor groove width.
FIGURE 5
FIGURE 5
(A) Superposition (stereo view) of the average structure for the central AAATTT sequence at dref = 10 Å (green) onto the central AAATTT motif in the x-ray structure of the B-DNA: d(CGCAAATTTGCG)2 (blue, pdb1S2R; (57)). (B) Superposition of the average structure for the central TATATA sequence at dref = 12 Å (green) onto the central TATA motif in the x-ray structure of the B-DNA decamer d(CGATATATCG)2 (blue, pdb1D29; (58)). The view is into the minor groove and for clarity only the eight central basepairs (heavy atoms) are shown.
FIGURE 6
FIGURE 6
Average minor groove width obtained during data gathering time with the program Curves (55,56) versus the reaction coordinate used to induce minor groove deformation (error bars indicate standard deviations).
FIGURE 7
FIGURE 7
Average global bending (calculated using Curves) obtained during data gathering time versus reaction coordinate (interstrand separation: dref; error bars indicate standard deviations).
FIGURE 8
FIGURE 8
(A) Central helical basepair roll angle versus minor groove opening reaction coordinate (reference distance, dref). (B) Central basepair steps using a stick representation. For clarity, only heavy atoms of average structures at dref = 17 Å are shown. The distance between the centers of the central basepairs is marked (double arrow). (C) Average central twist (average over five central steps) versus minor groove opening reaction coordinate (dref).
FIGURE 9
FIGURE 9
Distribution of nucleic acid backbone dihedral angles during data gathering time at dref = 10 Å (black line), 15 Å (dashed line), 18 Å (dotted dashed line), and 20 Å (dotted line).
FIGURE 10
FIGURE 10
Stereo view of the average DNA structure (central AAATTT sequence) at dref = 18 Å (A) and dref = 20 Å (B). The view is into the minor groove and only heavy atoms are shown (stick representation). The structures are available from the author upon request.

Similar articles

Cited by

References

    1. Hagerman, P. J. 1990. Flexibility of DNA. Annu. Rev. Biochem. 59:755–781. - PubMed
    1. El Hassan, M. A., and C. R. Calladine. 1995. The assessment of the geometry of dinucleotide steps in double-helical DNA: a new local calculation scheme. J. Mol. Biol. 251:648–664. - PubMed
    1. Olson, W. K., A. A. Gorin, X.-J. Lu, L. M. Hock, and V. B. Zhurkin. 1998. DNA sequence dependent deformability deduced from protein-DNA crystal complexes. Proc. Natl. Acad. Sci. USA. 95:11163–11168. - PMC - PubMed
    1. Packer, M. J., M. P. Dauncey, and C. A. Hunter. 2000. Sequence-dependent DNA structure: tetranucleotide conformational maps. J. Mol. Biol. 295:85–103. - PubMed
    1. Rhodes, D., J. W. Schwabe, L. Chapman, and L. Fairall. 1996. Towards an understanding of protein-DNA recognition. Philos. Trans. R. Soc. Lond. B Biol. Sci. 351:501–509. - PubMed

Publication types