The SCABRA3 nuclear gene encodes the plastid RpoTp RNA polymerase, which is required for chloroplast biogenesis and mesophyll cell proliferation in Arabidopsis
- PMID: 16698900
- PMCID: PMC1489898
- DOI: 10.1104/pp.106.080069
The SCABRA3 nuclear gene encodes the plastid RpoTp RNA polymerase, which is required for chloroplast biogenesis and mesophyll cell proliferation in Arabidopsis
Abstract
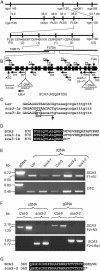
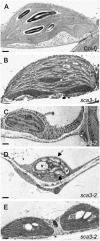
In many plant species, a subset of the genes of the chloroplast genome is transcribed by RpoTp, a nuclear-encoded plastid-targeted RNA polymerase. Here, we describe the positional cloning of the SCABRA3 (SCA3) gene, which was found to encode RpoTp in Arabidopsis (Arabidopsis thaliana). We studied one weak (sca3-1) and two strong (sca3-2 and sca3-3) alleles of the SCA3 gene, the latter two showing severely impaired plant growth and reduced pigmentation of the cotyledons, leaves, stem, and sepals, all of which were pale green. The leaf surface was extremely crumpled in the sca3 mutants, although epidermal cell size and morphology were not perturbed, whereas the mesophyll cells were less densely packed and more irregular in shape than in the wild type. A significant reduction in the size, morphology, and number of chloroplasts was observed in homozygous sca3-2 individuals whose photoautotrophic growth was consequently perturbed. Microarray analysis showed that several hundred nuclear genes were differentially expressed in sca3-2 and the wild type, about one-fourth of which encoded chloroplast-targeted proteins. Quantitative reverse transcription-PCR analyses showed that the sca3-2 mutation alters the expression of the rpoB, rpoC1, clpP, and accD plastid genes and the SCA3 paralogs RpoTm and RpoTmp, which respectively encode nuclear-encoded mitochondrion or dually targeted RNA polymerases. Double-mutant analysis indicated that RpoTmp and SCA3 play redundant functions in plant development. Our findings support a role for plastids in leaf morphogenesis and indicate that RpoTp is required for mesophyll cell proliferation.
Figures


Similar articles
-
Arabidopsis Plastid-RNA Polymerase RPOTp Is Involved in Abiotic Stress Tolerance.Plants (Basel). 2020 Jul 2;9(7):834. doi: 10.3390/plants9070834. Plants (Basel). 2020. PMID: 32630785 Free PMC article.
-
Chloroplast development affects expression of phage-type RNA polymerases in barley leaves.Plant J. 2004 May;38(3):460-72. doi: 10.1111/j.0960-7412.2004.02060.x. Plant J. 2004. PMID: 15086795
-
Arabidopsis MDA1, a nuclear-encoded protein, functions in chloroplast development and abiotic stress responses.PLoS One. 2012;7(8):e42924. doi: 10.1371/journal.pone.0042924. Epub 2012 Aug 8. PLoS One. 2012. PMID: 22905186 Free PMC article.
-
Chloroplast RNA polymerases: Role in chloroplast biogenesis.Biochim Biophys Acta. 2015 Sep;1847(9):761-9. doi: 10.1016/j.bbabio.2015.02.004. Epub 2015 Feb 11. Biochim Biophys Acta. 2015. PMID: 25680513 Review.
-
The plastid transcription machinery and its coordination with the expression of nuclear genome: Plastid-Encoded Polymerase, Nuclear-Encoded Polymerase and the Genomes Uncoupled 1-mediated retrograde communication.Philos Trans R Soc Lond B Biol Sci. 2020 Jun 22;375(1801):20190399. doi: 10.1098/rstb.2019.0399. Epub 2020 May 4. Philos Trans R Soc Lond B Biol Sci. 2020. PMID: 32362266 Free PMC article. Review.
Cited by
-
Anterograde signaling controls plastid transcription via sigma factors separately from nuclear photosynthesis genes.Nat Commun. 2022 Dec 2;13(1):7440. doi: 10.1038/s41467-022-35080-0. Nat Commun. 2022. PMID: 36460634 Free PMC article.
-
The Arabidopsis organelle-localized glycyl-tRNA synthetase encoded by EMBRYO DEFECTIVE DEVELOPMENT1 is required for organ patterning.J Exp Bot. 2012 Sep;63(14):5233-43. doi: 10.1093/jxb/ers184. Epub 2012 Jul 12. J Exp Bot. 2012. PMID: 22791832 Free PMC article.
-
Disruption of the psbA gene by the copy correction mechanism reveals that the expression of plastid-encoded genes is regulated by photosynthesis activity.J Plant Res. 2007 May;120(3):421-30. doi: 10.1007/s10265-007-0082-3. Epub 2007 Apr 11. J Plant Res. 2007. PMID: 17427034
-
Riddled with holes: Understanding air space formation in plant leaves.PLoS Biol. 2021 Dec 6;19(12):e3001475. doi: 10.1371/journal.pbio.3001475. eCollection 2021 Dec. PLoS Biol. 2021. PMID: 34871299 Free PMC article. Review.
-
The GDC1 gene encodes a novel ankyrin domain-containing protein that is essential for grana formation in Arabidopsis.Plant Physiol. 2011 Jan;155(1):130-41. doi: 10.1104/pp.110.165589. Epub 2010 Nov 19. Plant Physiol. 2011. PMID: 21098677 Free PMC article.
References
-
- Allison LA (2000) The role of sigma factors in plastid transcription. Biochimie 82: 537–548 - PubMed
-
- Alonso JM, Stepanova AN, Leisse TJ, Kim CJ, Chen H, Shinn P, Stevenson DK, Zimmerman J, Barajas P, Cheuk R, et al (2003) Genome-wide insertional mutagenesis of Arabidopsis thaliana. Science 301: 653–657 - PubMed
-
- Arabidopsis Genome Initiative (2000) Analysis of the genome sequence of the flowering plant Arabidopsis thaliana. Nature 408: 796–815 - PubMed
Publication types
MeSH terms
Substances
LinkOut - more resources
Full Text Sources
Molecular Biology Databases

