

Differentiation of proteins based on characteristic patterns of association and denaturation in solutions of SDS
- PMID: 16698920
- PMCID: PMC1472413
- DOI: 10.1073/pnas.0602816103
Differentiation of proteins based on characteristic patterns of association and denaturation in solutions of SDS
Abstract
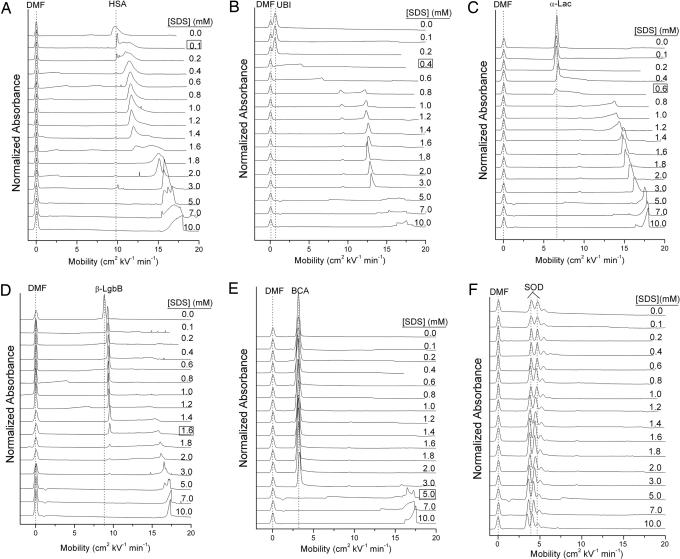
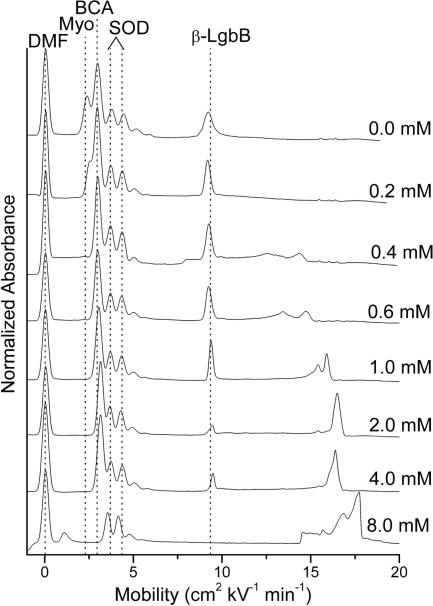
This paper shows that proteins display an unexpectedly wide range of behaviors in buffers containing moderate (0.1-10 mM) concentrations of SDS (complete unfolding, formation of stable intermediate states, specific association with SDS, and various kinetic phenomena); capillary electrophoresis provides a convenient method of examining these behaviors. Examination of the dynamics of the response of proteins to SDS offers a way to differentiate and characterize proteins. Based on a survey of 18 different proteins, we demonstrate that proteins differ in the concentrations of SDS at which they denature, in the rates of unfolding in SDS, and in the profiles of the denaturation pathways. We also demonstrate that these differences can be exploited in the analysis of mixtures.
Conflict of interest statement
Conflict of interest statement: No conflicts declared.
Figures
References
-
- Gallagher S. R. In: Current Protocols in Molecular Biology. Ausubel F. M., Brent R., Kingston R. E., Moore D. D., Seidman J. G., Smith J. A., Struhl K, editors. New York: Wiley; 2003.
-
- Moosavi-Movahedi A. A., Gharanfoli M., Nazari K., Shamsipur M., Chamani J., Hemmateenejad B., Alavi M., Shokrollahi A., Habibi-Rezaei M., Sorenson C., Sheibani N. Colloids Surf. B. 2005;43:150–157. - PubMed
-
- Takeda K., Moriyama Y. Curr. Top. Colloid Interface Sci. 1997;1:109–135.
-
- Park Y.-D., Jung J.-Y., Kim D.-W., Kim W.-S., Hahn M.-J., Yang J.-M. J. Protein Chem. 2003;22:463–471. - PubMed
Publication types
MeSH terms
Substances
Grants and funding
LinkOut - more resources
Full Text Sources
Other Literature Sources
