. 2006 May 23;103(21):8066-71.
doi: 10.1073/pnas.0509932103. Epub 2006 May 12.

The maximum number of torque-generating units in the flagellar motor of Escherichia coli is at least 11

Affiliations

The maximum number of torque-generating units in the flagellar motor of Escherichia coli is at least 11

Stuart W Reid et al. Proc Natl Acad Sci U S A. .

Abstract

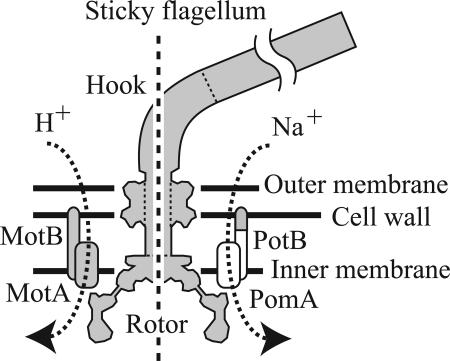
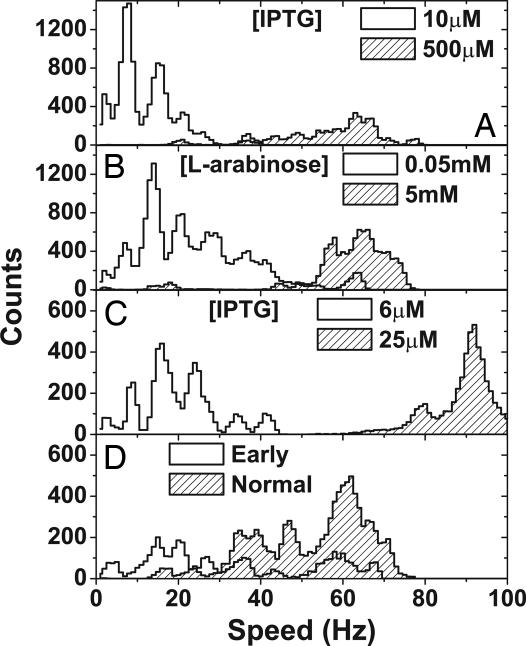
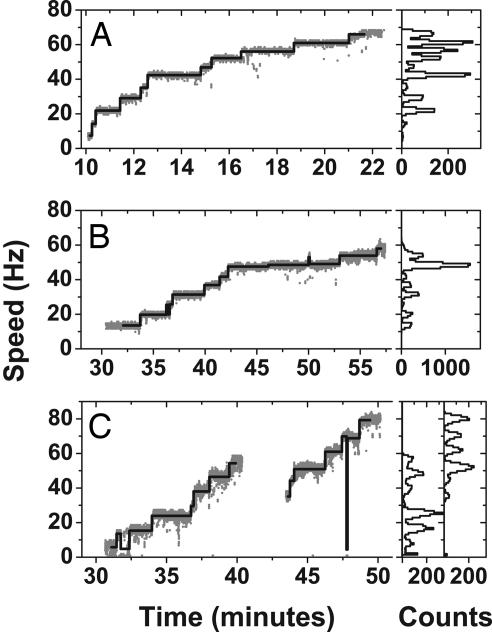
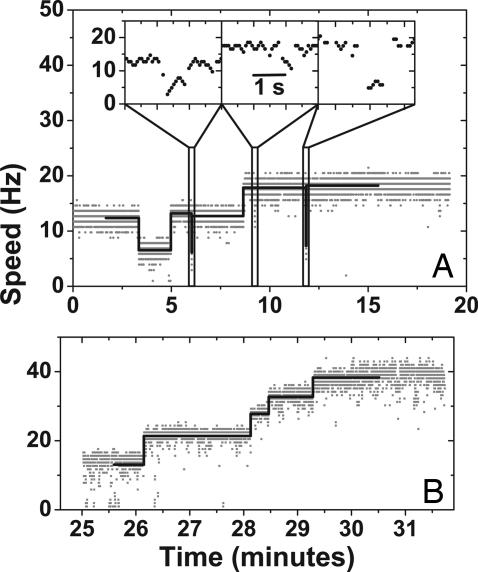
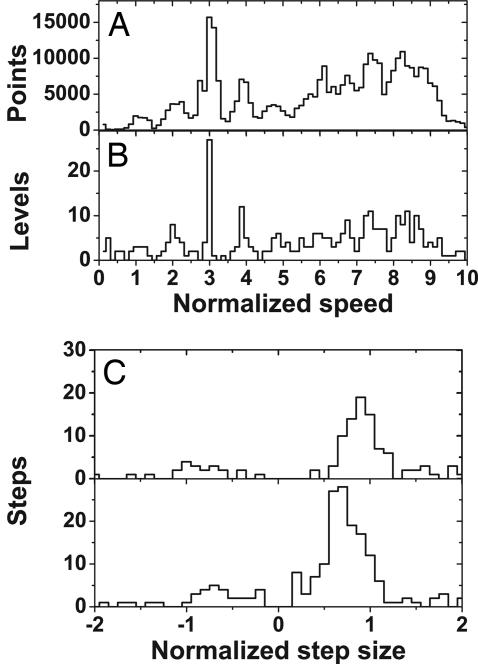
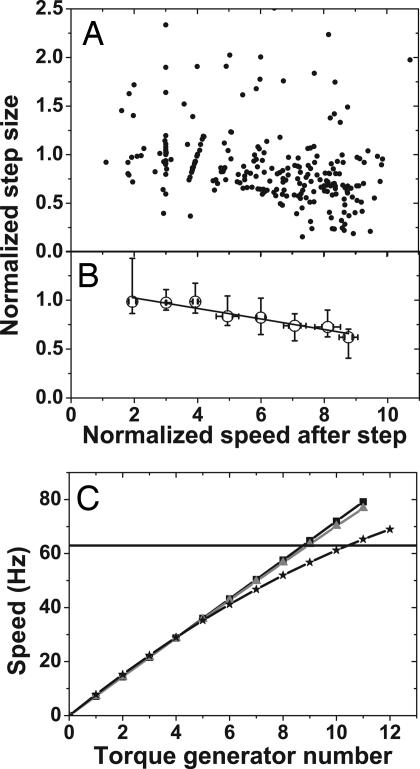
Torque is generated in the rotary motor at the base of the bacterial flagellum by ion translocating stator units anchored to the peptidoglycan cell wall. Stator units are composed of the proteins MotA and MotB in proton-driven motors, and they are composed of PomA and PomB in sodium-driven motors. Strains of Escherichia coli lacking functional stator proteins produce flagella that do not rotate, and induced expression of the missing proteins leads to restoration of motor rotation in discrete speed increments, a process known as "resurrection." Early work suggested a maximum of eight units. More recent indications that WT motors may contain more than eight units, based on recovery of disrupted motors, are inconclusive. Here we demonstrate conclusively that the maximum number of units in a motor is at least 11. Using back-focal-plane interferometry of 1-mum polystyrene beads attached to flagella, we observed at least 11 distinct speed increments during resurrection with three different combinations of stator proteins in E. coli. The average torques generated by a single unit and a fully induced motor were lower than previous estimates. Speed increments at high numbers of units are smaller than those at low numbers, indicating that not all units in a fully induced motor are equivalent.


Conflict of interest statement

Conflict of interest statement: No conflicts declared.

Figures

Fig. 1.
Fig. 1.
Schematic of the flagellar motor. Components derived from E. coli and V. alginolyticus are shown in gray and white, respectively. (Left) The proton-driven stator consisting of MotA and MotB. (Right) The chimeric sodium-driven stator consisting of PomA and PotB.
Fig. 2.
Fig. 2.
Steady-state induction of stator proteins. (A) Speed histograms for MotA strain populations at low (10 μM IPTG, 40 cells) and high (500 μM IPTG, 26 cells) induction. (B) Speed histograms for MotAB strain populations at low (0.05 mM l-arabinose, 107 cells) and high (5 mM l-arabinose, 52 cells) induction. (C) Chimera strain in 85 mM sodium chloride at low (5 μM ITPG, 30 cells) and high (25 μM IPTG, 30 cells) induction. (D) WT strain harvested early (2 h, 24 cells) or at the normal time (4 h, 52 cells). Each cell was measured for 20.4 s, producing 194 data points, with each one “count.” Speed bins correspond to the resolution of the power spectrum (1 Hz). At low induction, peaks occur because of discrete numbers of torque-generating units.
Fig. 3.
Fig. 3.
Resurrection traces for the MotA strain (A), the MotAB strain (B), and the chimera strain (C). Levels found by the step-finding routine are superimposed, and speed histograms are shown on the right. The MotA strain shows levels 1–11 (possibly 12); the MotAB strain shows levels 2–10, and the chimera strain shows levels 1–7 and 5–10 (or possibly 4–9) in two different cells recorded consecutively in the same preparation.
Fig. 4.
Fig. 4.
Speed changes during extended observations. (A) An extended measurement of a cell of the MotA strain grown in 20 μM IPTG. This trace shows slow removal and addition of torque-generating units and brief speed reductions consisting of one or two units (expanded in Insets). Levels found by the step-finding routine are superimposed. (B) An extended measurement of the WT strain harvested early (after 2 h of growth). Stepwise increases in speed consistent with those in resurrection experiments are seen in levels 2–6.
Fig. 5.
Fig. 5.
Results from the step-finder routine. (A) Histogram of combined normalized speeds for 23 resurrections of the MotA and MotAB strains. The average normalization constant is 6.9 Hz. (B) Normalized levels found by the step-finding algorithm. Level peaks coincide with speed peaks in A. (C) Histogram of found steps for speeds <5.5 normalized units (Upper) and >5.5 units (Lower). The split illustrates the decrease in step size at increasing speeds.
Fig. 6.
Fig. 6.
Step size during resurrection experiments. (A) Normalized step size vs. normalized speed. Only upwards steps are shown. (B) Median and interquartile range for the data in A, binned according to speed after the step, illustrating the decreasing trend. A linear fit to the median values is shown. (C) Models for speed vs. torque-generating unit number. Squares, each unit contributes 7.2 Hz; triangles, the average unit torque decreases according to the measured torque-speed curve (15); stars, step size depends on speed according to the linear fit in B. The horizontal line at 63 Hz marks the average speed of fully induced cells.

References

    1. Berry R. M., Armitage J. P. Adv. Microb. Physiol. 1999;41:291–337. - PubMed
    1. Berry R. M. In: Molecular Motors. Schliwa M., editor. Berlin: Wiley; 2003. pp. 111–140.
    1. Berg H. C. Annu. Rev. Biochem. 2003;72:19–54. - PubMed
    1. Macnab R. M. Annu. Rev. Microbiol. 2003;57:77–100. - PubMed
    1. Blair D. F. FEBS Lett. 2003;543:86–95. - PubMed

Publication types

LinkOut - more resources