. 2006 Jun;80(11):5655-9.
doi: 10.1128/JVI.00166-06.

Rapid upregulation of interferon-regulated and chemokine mRNAs upon injection of 108 international units, but not lower doses, of adenoviral vectors into the brain

Affiliations

Rapid upregulation of interferon-regulated and chemokine mRNAs upon injection of 108 international units, but not lower doses, of adenoviral vectors into the brain

Jeffrey M Zirger et al. J Virol. 2006 Jun.

Abstract

The innate immune response, characterized by the rapid induction of proinflammatory genes, plays an important role in immune responses to viral vectors utilized in gene therapy. We demonstrate that several innate proinflammatory mRNAs, i.e., those coding for the interferon (IFN)-regulated proteins interferon regulatory factor 1, 2',5'-oligoadenylate synthetase, and double-stranded-RNA-dependent protein kinase as well as those coding for the chemokines RANTES, IFN-gamma-inducible protein 10, and monocyte chemoattractant protein 1, were all increased in a statistically significant manner in response to 1 x 10(8) IU, but not lower doses, of a first-generation adenovirus injected into the naïve brain. This indicates the presence of a threshold dosage of adenovirus needed to elicit an acute innate inflammatory response.


Figures
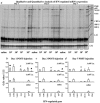
FIG. 1.
FIG. 1.
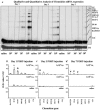
Analysis of IFN-regulated mRNA expression. (a) RPA gel showing bands corresponding to mRNAs of IFN-regulated mRNAs 1 day (left panel), 3 days (middle panel), and 7 days (right panel) after intracranial injection of RAd35. Dosages of RAd35 (1 × 10⁵ to 1 × 10⁸) or saline are shown below the lanes. Sizes of individual IFN-regulated mRNA probes are indicated at the far right. (b to d) Quantification of IFN-regulated mRNA expression using ImageJ software. The band intensity was determined by dividing the optical density (OD) value for each IFN-regulated mRNA by the OD value for the L32 control in each lane and was expressed as a percentage. To obtain a representative reading of the denser L32 bands, these bands were exposed overnight (lower L32 image), while for readings from the other mRNAs, the gels were exposed for 5 days. (b) Quantification of IFN-regulated mRNA expression 1 day after CNS injection of saline or 1 × 10⁷ to 1 × 10⁸ IU of RAd35. (c) Quantification of IFN-regulated mRNA expression 3 days after CNS injection of saline or 1 × 10⁷ to 1 × 10⁸ IU of RAd35. (d) Quantification of IFN-regulated mRNA expression 7 days after CNS injection of saline or 1 × 10⁷ to 1 × 10⁸ IU of RAd35. *, P < 0.1 compared to control (saline) OAS value; ▴, P < 0.1 compared to control PKR value; ▪, P < 0.1 compared to control IRF-1 value at each time point. Quantification of expression after the injection of 1 × 10⁵ to 1 × 10⁶ IU of virus is not illustrated because changes were not statistically significant. We only show expression below (1 × 10⁷ IU) and above (1 × 10⁸ IU) the threshold of induction of statistically significant increases in mRNA expression.
FIG. 2.
FIG. 2.
Analysis of chemokine mRNA expression. (a) RPA gel showing bands corresponding to mRNAs of chemokine genes 1 day (left panel), 3 days (middle panel), and 7 days (right panel) after intracranial injection of RAd35. Dosages of RAd35 (1 × 10⁵ to 1 × 10⁸) or saline are shown below the lanes. Sizes of individual chemokine mRNA probes are indicated at the far right. (b to d) Quantification of chemokine mRNA expression using ImageJ software. The band intensity was determined by dividing the OD value for each chemokine mRNA by the OD value for the L32 control in each lane and was expressed as a percentage. To obtain a representative reading of the denser L32 bands, these bands were exposed overnight (lower L32 image), while for readings from the other mRNAs, the gels were exposed for 5 days. (b) Quantification of chemokine mRNA expression 1 day after CNS injection of saline or 1 × 10⁷ to 1 × 10⁸ IU of RAd35. (c) Quantification of chemokine mRNA expression 3 days after CNS injection of saline or 1 × 10⁷ to 1 × 10⁸ IU of RAd35. (d) Quantification of chemokine mRNA expression 7 days after CNS injection of saline or 1 × 10⁷ to 1 × 10⁸ IU of RAd35. *, P < 0.1 compared to control (saline) IP-10 value; ▴, P < 0.1 compared to control MCP-1 value; ▪, P < 0.1 compared to control RANTES value at each time point; #, P < 0.1 compared to day 1 RANTES, IP-10, and MCP-1 values after injection of 1 × 10⁸ IU. Quantification of the injection of 1 × 10⁵ to 1 × 10⁶ IU of virus is not illustrated because changes were not statistically significant. We only show expression below (1 × 10⁷ IU) and above (1 × 10⁸ IU) the threshold of induction of significant increases in mRNA expression.
FIG. 3.
FIG. 3.
Qualitative analysis of β-galactosidase (β-Gal) transgene expression. Qualitative analysis of the distribution of β-Gal-expressing cells in the CNSs of C57BL/6 mice 4, 30, and 120 days following injection of 1 × 10⁷ IU of RAd β-Gal (an adenovirus carrying the β-Gal transgene) showed robust transgene expression over time. Scale bar, 1 mm.

References

    1. Asensio, V. C., and I. L. Campbell. 1997. Chemokine gene expression in the brains of mice with lymphocytic choriomeningitis. J. Virol. 71:7832-7840. - PMC - PubMed
    1. Byrnes, A. P., R. E. MacLaren, and H. M. Charlton. 1996. Immunological instability of persistent adenovirus vectors in the brain: peripheral exposure to vector leads to renewed inflammation, reduced gene expression, and demyelination. J. Neurosci. 16:3045-3055. - PMC - PubMed
    1. Byrnes, A. P., J. E. Rusby, M. J. Wood, and H. M. Charlton. 1995. Adenovirus gene transfer causes inflammation in the brain. Neuroscience 66:1015-1024. - PubMed
    1. Byrnes, A. P., M. J. Wood, and H. M. Charlton. 1996. Role of T cells in inflammation caused by adenovirus vectors in the brain. Gene Ther. 3:644-651. - PubMed
    1. Carr, M. W., S. J. Roth, E. Luther, S. S. Rose, and T. A. Springer. 1994. Monocyte chemoattractant protein 1 acts as a T-lymphocyte chemoattractant. Proc. Natl. Acad. Sci. USA 91:3652-3656. - PMC - PubMed