. 2006 May;2(5):e41.
doi: 10.1371/journal.pcbi.0020041. Epub 2006 May 12.

Inferring loss-of-heterozygosity from unpaired tumors using high-density oligonucleotide SNP arrays

Affiliations

Inferring loss-of-heterozygosity from unpaired tumors using high-density oligonucleotide SNP arrays

Rameen Beroukhim et al. PLoS Comput Biol. 2006 May.

Abstract

Loss of heterozygosity (LOH) of chromosomal regions bearing tumor suppressors is a key event in the evolution of epithelial and mesenchymal tumors. Identification of these regions usually relies on genotyping tumor and counterpart normal DNA and noting regions where heterozygous alleles in the normal DNA become homozygous in the tumor. However, paired normal samples for tumors and cell lines are often not available. With the advent of oligonucleotide arrays that simultaneously assay thousands of single-nucleotide polymorphism (SNP) markers, genotyping can now be done at high enough resolution to allow identification of LOH events by the absence of heterozygous loci, without comparison to normal controls. Here we describe a hidden Markov model-based method to identify LOH from unpaired tumor samples, taking into account SNP intermarker distances, SNP-specific heterozygosity rates, and the haplotype structure of the human genome. When we applied the method to data genotyped on 100 K arrays, we correctly identified 99% of SNP markers as either retention or loss. We also correctly identified 81% of the regions of LOH, including 98% of regions greater than 3 megabases. By integrating copy number analysis into the method, we were able to distinguish LOH from allelic imbalance. Application of this method to data from a set of prostate samples without paired normals identified known regions of prevalent LOH. We have developed a method for analyzing high-density oligonucleotide SNP array data to accurately identify of regions of LOH and retention in tumors without the need for paired normal samples.


Conflict of interest statement

Competing interests. The authors have declared that no competing interests exist.

Figures

Figure 1
Figure 1. The Elements Included in the HMM for LOH Inference
Unobserved LOH states (LOSS or RET) of SNP markers generate observed genotype calls via emission probabilities. The solid arrows indicate the transition probabilities between LOH states, and the dashed arrows indicate LD-induced dependencies between consecutive SNP genotypes.
Figure 2
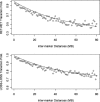
Figure 2. Comparison of Predicted to Empirically Determined LOH Transition Probabilities
Empirically determined transition probabilities (circles) between RET loci (top graph) and LOSS loci (bottom graph) are compared to those predicted by Equation 1 (black lines).
Figure 3
Figure 3. Comparison of LOH Inferred from Unpaired Tumors to LOH Observed in Tumor/Normal Pairs
(A) Results from 10 K SNP array data. Each column represents a sample, with SNP markers from Chromosome 10 displayed from the p terminus (top) to the q terminus (bottom) (not all markers are displayed at this resolution). Tumor/normal observations (left) represent direct comparisons of tumor to normal genotypes. Here, SNP markers observed as having undergone LOH are indicated in blue, retention is shown in yellow, and noninformative SNPs are indicated in grey. Inferences from unpaired tumor data represent the probability of each SNP having undergone LOH, as made by the basic HMM (center) and HC/LD-HMM (right). Here, a high probability of LOH (LOSS) is also indicated in blue, a high probability of retention (RET) is indicated in yellow, and indeterminate SNPs with an almost equal probability of either state are indicated in white. Occasionally, regions that are noninformative in the tumor/normal comparison are falsely inferred as LOH by the basic HMM in the unpaired data (red arrows); some of these false regions are corrected by the HC/LD-HMM (green arrows). (B) Results from 100 K SNP array data, shown as in (A). Data from Chromosome 21 are shown to highlight the detection of false LOH in the analysis of unpaired tumor data, and are not representative of the frequency of true LOH events in this sample set. Almost all regions falsely inferred as LOH by the basic HMM are correctly inferred by the HC/LD-HMM. The blue arrows indicate a region of true LOH, which is correctly identified by both the basic and HC/LD-HMM.
Figure 4
Figure 4. Accounting for LD by the LD-HMM Significantly Reduces False LOH Inferences from Data Obtained at High Marker Density
(A) Inferences from the basic HMM applied to 100 K SNP array data are shown for Chromosome 4 in normal samples. Data are shown as in Figure 3. (B) The genotypes of one region of falsely inferred LOH reveal a region of linkage disequilibrium (dashed red box), also identified by the HapMap project. The sample in column “D” contains one haplotype, the samples in columns “E” through “K” contain another haplotype, and the samples in columns “A” through “C” are heterozygous. (C) Improved LOH inferences after application of the LD-HMM.
Figure 5
Figure 5. Correspondence between LOH and Copy Number
For each inferred copy number (x-axis), the proportion of SNP markers (y-axis) observed in the 10 K dataset of tumor/normal pairs to have undergone LOH (blue) or retention (red) are shown.
Figure 6
Figure 6. Inferred LOH in Prostate Cancer Samples Identifies Regions of LOH Known to Be Frequent in Prostate Cancer
The mean LOH probability across 34 prostate cancer samples is plotted along the left for all chromosomes. Peak regions of LOH are noted, and data from Chromosomes 8, 13, and 17 are highlighted on the right. These data are displayed as in Figure 3. Note that in this view, SNPs are visualized proportionally to physical distance along the chromosome, and most SNPs are not projected due to proximity to their neighbors. The red dotted lines indicate the approximate chromosomal positions of putative TSGs.

Similar articles

Cited by

References

    1. Knudson AG. Mutation and cancer: statistical study of retinoblastoma. Proc Natl Acad Sci U S A. 1971;68:820–823. - PMC - PubMed
    1. Knudson AG. Two genetic hits (more or less) to cancer. Nat Rev Cancer. 2001;1:157–162. - PubMed
    1. Huang J, Wei W, Zhang J, Liu G, Bignell GR, et al. Whole genome DNA copy number changes identified by high density oligonucleotide arrays. Hum Genomics. 2004;1:287–299. - PMC - PubMed
    1. McEvoy CR, Morley AA, Firgaira FA. Evidence for whole chromosome 6 loss and duplication of the remaining chromosome in acute lymphoblastic leukemia. Genes Chromosomes Cancer. 2003;37:321–325. - PubMed
    1. Girard L, Zochbauer-Muller S, Virmani AK, Gazdar AF, Minna JD. Genome-wide allelotyping of lung cancer identifies new regions of allelic loss, differences between small cell lung cancer and non-small cell lung cancer, and loci clustering. Cancer Res. 2000;60:4894–4906. - PubMed

Publication types