. 2006 May 15;20(10):1321-30.
doi: 10.1101/gad.1393106.

MOZ is essential for maintenance of hematopoietic stem cells

Affiliations

MOZ is essential for maintenance of hematopoietic stem cells

Takuo Katsumoto et al. Genes Dev. .

Abstract

Monocytic leukemia zinc-finger protein (MOZ), a MYST family histone acetyltransferase, is involved in the chromosome translocations associated with acute myeloid leukemia. MOZ acts as a transcriptional coactivator for AML1, which is essential for establishment of definitive hematopoiesis. To investigate the roles of MOZ in normal hematopoiesis, we generated MOZ-null mice. MOZ-/- mice died around embryonic day 15 (E15). In MOZ-/- E14.5 embryos, hematopoietic stem cells, lineage-committed progenitors, and B lineage cells were severely reduced. On the other hand, arrest of erythroid maturation and elevated myeloid lineage populations were observed. MOZ-deficient fetal liver cells could not reconstitute hematopoiesis of recipients after transplantation. Analysis using microarray and flow cytometry revealed that expression of thrombopoietin receptor (c-Mpl), HoxA9, and c-Kit was down-regulated. These results show that MOZ is required for maintenance of hematopoietic stem cells, and that it plays a role in differentiation of erythroid and myeloid cells. Some aspects of the MOZ-/- phenotype are similar to that observed in PU.1-deficient mice. MOZ was able to interact with PU.1 and activate PU.1-dependent transcription, thus suggesting a physical and functional link between PU.1 and MOZ.


Figures
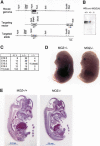
Figure 1.
Figure 1.
Targeted disruption of the mouse MOZ gene. (A) Structure of the mouse MOZ locus, the targeting construct, and the targeted locus. The targeting vector contains the HpaI–EcoRI MOZ genomic fragment, in which exon 2 containing the first ATG is replaced with a 1.1-kb pMC1–neor–poly(A) cassette, and a 0.8-kb DT-A fragment at the 3′ terminus. The open and filled boxes represent the noncoding and coding regions of MOZ exon 2, respectively. (B) Expression of MOZ protein in MOZ+/+, MOZ+/− and MOZ−/− embryos. Lysates were prepared from E12.5 embryos derived from MOZ+/− mice intercrosses, and were analyzed by Western blotting using anti-MOZ antibody. (C) Genotyping of offspring from MOZ+/− intercrosses was performed by PCR analysis using genomic DNAs from tails of adult mice and heads of embryos at the stages indicated. (D) Phenotypic comparison of MOZ+/− and MOZ−/− embryos at E14.5. The MOZ−/− fetus appears pale and the liver is small. (E) Sagital sections of E14.5 embryos of wild-type and null-mutant mice stained with hematoxylin and eosin.
Figure 2.
Figure 2.
Reduction in cell number and colony-forming cells in MOZ−/− embryos. (A) Number of cells in fetal liver. Fetal livers from E14.5 MOZ+/+ (n = 6), MOZ+/− (n = 23), and MOZ−/− (n = 10) embryos were dispersed into single-cell suspensions and the number of cells was counted. P-values were calculated by two-tailed unequal-variance t-test, as compared with MOZ+/+ embyros. (*) P < 0.05; (**) P < 0.01. (B) Colony-forming cells in fetal liver. Approximately 1.5 × 10⁴ fetal liver cells were cultured in 1% methylcellulose, and the number of mixed lineage, erythroid, and myeloid colonies was counted.
Figure 3.
Figure 3.
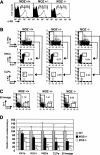
Decrease in hematopoietic stem cells and progenitors in MOZ−/− fetal liver. (A) Population of c-Kitlo and c-Kithi cells. Cells were prepared from E14.5 fetal liver cells, stained with Lineage-Biotin-streptavidin-PerCP-Cy5.5 and c-Kit-APC. Populations of c-Kitlo and c-Kithi cells in Lin fractions were analyzed by flow cytometry. The filled area exhibits background staining. (B) Population of HSCs and CLPs. Cells from E14.5 fetal liver cells were stained with Sca-1-FITC, IL-7Rα-PE, Lineage (B220, CD3ε, Gr-1, Ter119)-Biotin-streptavidin-PerCP-Cy5.5 and c-Kit-APC. Lin IL-7Rα Sca-1+ c-Kit+ cells (HSCs) and Lin IL-7Rα+ Sca-1+ c-Kit+ cells (CLPs) were analyzed by flow cytometry. (C) Population of B lymphocytes. Cells from E14.5 fetal liver cells were stained with CD19-PE and Gr-1-APC. CD19+ B lineage cells and Gr-1+ myeloid lineage cells were analyzed by flow cytometry. (D) Numbers of c-Kitlo cells, c-Kithi cells, HSCs, CLPs, CD19+ B lineage cells, and Gr-1+ myeloid lineage cells. Results represent average values for the relative number of cells per embryo. E14.5 MOZ+/+ (n = 6), MOZ+/− (n = 22) and MOZ−/− (n = 9) fetal livers were used for analysis of HSCs and CLPs. E14.5 MOZ+/+ (n = 8), MOZ+/− (n = 10), and MOZ−/− (n = 4) fetal livers were used for B lineage and myeloid cells. P-values were calculated by two-tailed unequal-variance t-test as compared with MOZ+/+ embryos. (*) P < 0.05; (**) P < 0.01; (***) P < 0.005.
Figure 4.
Figure 4.
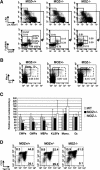
Changes in populations of myeloid and erythroid cells in MOZ−/− fetal liver. (A) Population of myeloid progenitors. Cells obtained from E14.5 fetal liver cells were stained with FcγR III/II-FITC, CD34-PE, Lin./Sca-1-Biotin-streptavidin-PerCP-Cy5.5, and c-Kit-APC. Populations of common myeloid progenitors (CMPs, Lin Sca-1 c-Kit+ CD34+ FcγR III/IIlo), granulocyte/macrophage progenitors (GMPs, Lin Sca-1 c-Kit+ CD34+ FcγR III/II+), megakaryocyte/erythroid progenitors (MEPs, Lin Sca-1 c-Kit+ CD34 FcγR III/IIlo), and KLSF fraction (Lin Sca-1 c-Kit+ CD34 FcγR III/II+) were analyzed by flow cytometry. (B) Myeloid lineage cells in MOZ−/− embryos. E14.5 fetal livers from MOZ+/+, MOZ+/−, and MOZ−/− embryos. Populations of granulocytic cells (Gr-1hi/Mac-1+) and monocytic cells (Gr-1lo/Mac-1+) were analyzed by flow cytometry. (C) Population of CMPs, GMPs, MEPs, KLSF fraction, granulocytic cells (Gr.), and monocytic cells (Mono.) in E14.5 fetal livers. Results represent the average values of the relative cell numbers of each cell fraction in MOZ+/+ (n = 6), MOZ+/− (n = 22), and MOZ−/− (n = 9) fetal livers. (D) Erythroid differentiation is impaired in MOZ−/− embryos. Cells from E14.5 MOZ+/+, MOZ+/−, and MOZ−/− embryos were stained with Ter119-biotin and CD71-PE followed by streptavidin-FITC and analyzed by flow cytometry.
Figure 5.
Figure 5.
Analysis of reconstitution activity of MOZ−/− fetal liver cells. (A–C) Fetal liver cells (2 × 10⁵ cells) from E14.5 MOZ+/+, MOZ+/−, and MOZ−/− (Ly5.2+) embryos were injected into lethally irradiated normal recipient mice (Ly5.1+/5.2+) together with an equal number of competitor fetal liver cells from wild-type E14.5 (Ly5.1+) embryos. Peripheral blood cells of recipients were analyzed for Ly5.1/Ly5.2 expression by flow cytometry at 2, 4, 8, or 12 wk after transplantation. Representative results at 4 wk are shown in A. A summary of the population of Ly5.2+ cells at 2, 4, 8, or 12 wk is shown in B. (C) In addition to peripheral blood, bone marrow cells, thymocytes, and splenocytes were also analyzed at 12 wk after transplantation. Results represent the average values for the population of Ly5.2+ cells. (D) Competitive reconstitution assay using increasing numbers of donor cells. Fetal E14.5 MOZ+/− and MOZ−/− liver cells (Ly5.2+) (2 × 10⁵ [1:1], 6 × 10⁵ [3:1], 1.8 × 10⁶ [9:1]) were injected into lethally irradiated normal recipient mice (Ly5.1+/5.2+) together with competitor fetal liver cells (2 × 10⁵) from wild-type E14.5 (Ly5.1+) embryos. Peripheral blood cells of recipients were analyzed for Ly5.1/Ly5.2 expression by flow cytometry at 2 wk after transplantation. Results represent the average values for the population of Ly5.2+ cells. (E) Reconstitution activity of E13.5 MOZ+/+ and MOZ−/− fetal liver cells. The average values for the population of Ly5.2+ cells at 2 wk in recipient peripheral blood are shown.
Figure 6.
Figure 6.
Expression levels of HoxA9 and c-Mpl were reduced in MOZ−/− fetal liver. (A) Gene expression profiling analysis. Total RNAs were purified from livers of two E12.5 MOZ+/+, MOZ+/−, and MOZ−/− embryos and were analyzed by oligonucleotide microarray. The 48 genes exhibiting changes in expression of more than twofold are shown. (B) RT–PCR analysis. Expression levels of HoxA9, c-Mpl, MOZ, and β-actin were analyzed by semiquantitative RT–PCR analysis using threefold serial dilutions of cDNA as templates. (C) Expression of HoxA9, c-Mpl, and c-Kit in Lin/Sca1+ cells. Lin/Sca1+ cells were sorted from E14.5 MOZ+/+ and MOZ−/− fetal livers using a flow cytometer. Expression levels of HoxA9, c-Mpl, c-Kit, and β-actin were analyzed by semiquantitative RT–PCR analysis using threefold serial dilution of cDNAs as templates. The relative intensities of the band are shown.
Figure 7.
Figure 7.
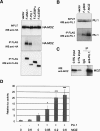
Interaction between MOZ and PU.1. (A) MOZ interacts with PU.1 and AML1 but not with C/EBPα and C/EBPε. 293T cells were cotransfected with HA-tagged MOZ, together with control vector, Flag-tagged AML1, PU.1, C/EBPα or C/EBPε. (Top) Expression of MOZ in the lysates of transfectants was detected by immunoblotting using anti-HA (3F10) antibody. Proteins were immunoprecipitated with anti-Flag (M2) antibody. Immunoprecipitates were analyzed by immunoblotting using anti-HA (middle) and anti-Flag (bottom) antibodies. (B, top) Reciprocal coimmunoprecipitation of PU.1 and MOZ. 293T cells were cotransfected with PU.1 together with control vector, Flag-tagged p300, or MOZ. Expression of PU.1 in the lysates of transfectants was detected by immunoblotting using anti-PU.1 antibody. Flag-tagged p300 and MOZ were immunoprecipitated with anti-Flag (M2) antibody. (Bottom) Immunoprecipitates were analyzed by immunoblotting using anti-PU.1 antibody. (C) Interaction of endogenous PU.1 and MOZ. Cell lysates were prepared from E14.5 fetal liver cells (5 × 10⁷) and PU.1 was immunoprecipitated with anti-PU.1 antibody. Cell lysates and immunoprecipitates were then analyzed by immunoblotting with anti-MOZ antibody (N). (D) MOZ activates PU.1-mediated transcription. SaOS2 cells were transfected with 100 ng of M-CSFR-luc, 50 ng of CMV-PU.1, indicated amounts (in micrograms) of LNCX-MOZ, and 2 ng of phRL-cmv. Cell lysates were prepared at 24 h after transfecton, and were analyzed for luciferase activity.

References

    1. Antonchuk J., Hyland C.D., Hilton D.J., Alexander W.S. Synergistic effects on erythropoiesis, thrombopoiesis, and stem cell competitiveness in mice deficient in thrombopoietin and steel factor receptors. Blood. 2004;104:1306–1313. - PubMed
    1. Borrow J., Stanton V.P., Jr., Andresen J.M., Becher R., Behm F.G., Chaganti R.S., Civin C.I., Disteche C., Dube I., Frischauf A.M., et al. The translocation t(8;16)(p11;p13) of acute myeloid leukaemia fuses a putative acetyltransferase to the CREB-binding protein. Nat. Genet. 1996;14:33–41. - PubMed
    1. Bristow C.A., Shore P. Transcriptional regulation of the human MIP-1α promoter by RUNX1 and MOZ. Nucleic Acids Res. 2003;31:2735–2744. - PMC - PubMed
    1. Calvo K.R., Sykes D.B., Pasillas M., Kamps M.P. Hoxa9 immortalizes a granulocyte-macrophage colony-stimulating factor-dependent promyelocyte capable of biphenotypic differentiation to neutrophils or macrophages, independent of enforced meis expression. Mol. Cell. Biol. 2000;20:3274–3285. - PMC - PubMed
    1. Carapeti M., Aguiar R.C., Goldman J.M., Cross N.C. A novel fusion between MOZ and the nuclear receptor coactivator TIF2 in acute myeloid leukemia. Blood. 1998;91:3127–3133. - PubMed

Publication types

MeSH terms