Comparative Study
. 2006 Aug;173(4):1885-91.
doi: 10.1534/genetics.106.060269. Epub 2006 May 15.

Toward a molecular understanding of pleiotropy

Affiliations
Comparative Study

Toward a molecular understanding of pleiotropy

Xionglei He et al. Genetics. 2006 Aug.

Abstract

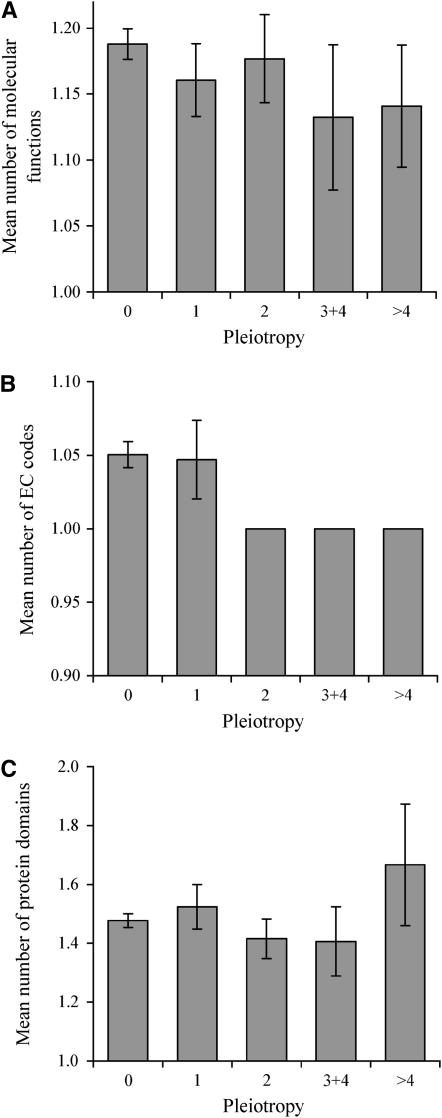
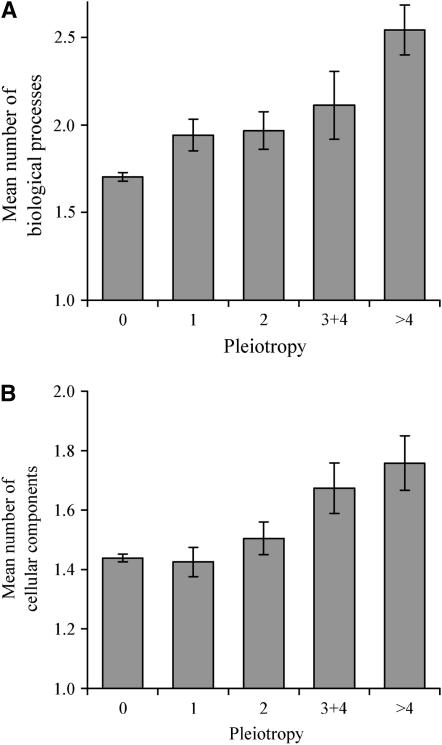
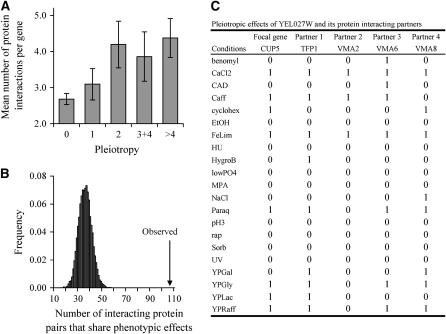
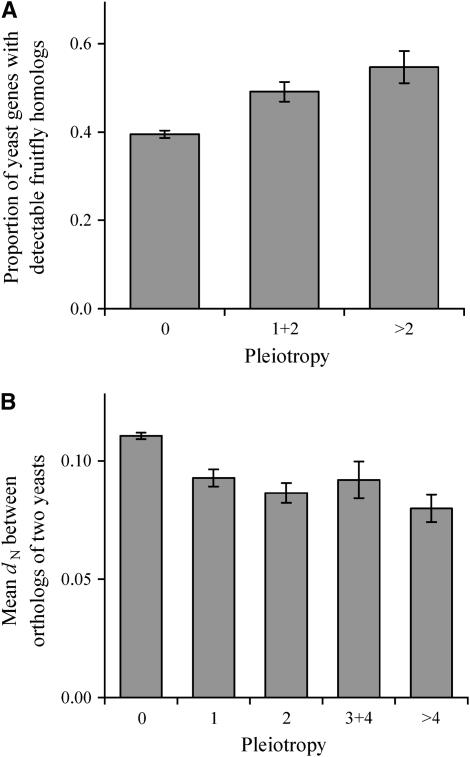
Pleiotropy refers to the observation of a single gene influencing multiple phenotypic traits. Although pleiotropy is a common phenomenon with broad implications, its molecular basis is unclear. Using functional genomic data of the yeast Saccharomyces cerevisiae, here we show that, compared with genes of low pleiotropy, highly pleiotropic genes participate in more biological processes through distribution of the protein products in more cellular components and involvement in more protein-protein interactions. However, the two groups of genes do not differ in the number of molecular functions or the number of protein domains per gene. Thus, pleiotropy is generally caused by a single molecular function involved in multiple biological processes. We also provide genomewide evidence that the evolutionary conservation of genes and gene sequences positively correlates with the level of gene pleiotropy.


Figures

F<sc>igure</sc> 1.—
Figure 1.—
Gene pleiotropy is not due to an excess of molecular functions per gene. Mean numbers of (A) GO-annotated molecular functions per gene, (B) EC codes per gene, and (C) protein domains per gene for genes of different levels of pleiotropy. Pleiotropy is measured by the number of adverse conditions (of 21 tested conditions) under which the homozygous gene-deletion strain shows significantly slower growth than under the control condition. For the unbinned data, the rank correlation coefficient is −0.01 (P = 0.57), −0.06 (P = 0.09), and 0.01 (P = 0.62) between pleiotropy and the numbers of molecular functions, EC codes, and protein domains, respectively. The numbers of genes in the five bins are 1890, 193, 164, 68, and 71, respectively, in A; 755, 64, 60, 18, and 20, respectively, in B; and 1213, 105, 89, 32, and 33, respectively, in C. Error bar shows one standard error of mean.
F<sc>igure</sc> 2.—
Figure 2.—
Gene pleiotropy correlates with (A) the number of GO-annotated biological processes and (B) the number of GO-annotated cellular components into which gene products are distributed. Pleiotropy is measured by the number of conditions under which the homozygous gene-deletion strain shows significantly slower growth than under the control condition. For the unbinned data, the rank correlation coefficient is 0.12 (P < 10−10) and 0.05 (P < 0.003) between pleiotropy and the numbers of biological processes and cellular components, respectively. The numbers of genes in the five bins are 2209, 244, 189, 88, and 92, respectively, in A and 2799, 268, 196, 92, and 95, respectively, in B. Error bar shows one standard error of mean.
F<sc>igure</sc> 3.—
Figure 3.—
Multiple PPIs underlie gene pleiotropy. (A) Gene pleiotropy correlates with the number of PPIs per gene. Pleiotropy is measured by the number of conditions under which the homozygous gene-deletion strain shows significantly slower growth than under the control condition. For the unbinned data, the rank correlation coefficient is 0.19 (P < 10−6) between pleiotropy and the number of PPIs per gene. The numbers of genes in the five bins are 501, 85, 61, 42, and 48, respectively. Error bar shows one standard error of mean. (B) Interacting proteins tend to share phenotypic effects. The arrow indicates the observed number of interacting protein pairs for which at least one phenotype (i.e., condition under which slow growth is found) is shared. The bars show the frequency distribution of the number of randomly paired proteins for which at least one phenotype is shared. The distribution is generated from 10,000 randomly rewired yeast PPI networks. (C) An example showing the phenotypes shared between a focal gene CUP5, also known as YEL027W, and all of its PPI partners. “0,” no phenotype; “1,” with phenotype. See Dudley et al. (2005) for the detailed information of the 21 conditions.
F<sc>igure</sc> 4.—
Figure 4.—
Evolutionary conservation of genes and gene sequences correlates with gene pleiotropy. (A) Proportion of yeast genes with detectable fruit fly homologs increases with the level of gene pleiotropy. The proportion is significantly greater among pleiotropic genes than among nonpleiotropic genes (χ2 = 29, P < 10−7). (B) The number of nonsynonymous substitutions per nonsynonymous site (dN) between orthologous genes of S. cerevisiae and S. bayanus decreases with gene pleiotropy. The numbers of yeast genes with fly homologs are 1317, 240, and 104, respectively, in the three bins of A. The numbers of genes are 2770, 259, 184, 86, and 87, respectively, in the five bins of B. Error bar shows one standard error of (A) the proportion estimate or (B) the mean dN estimate.

References

    1. Ashburner, M., C. A. Ball, J. A. Blake, D. Botstein, H. Butler et al., 2000. Gene ontology: tool for the unification of biology: the Gene Ontology Consortium. Nat. Genet. 25: 25–29. - PMC - PubMed
    1. Barton, N. H., 1990. Pleiotropic models of quantitative variation. Genetics 124: 773–782. - PMC - PubMed
    1. Brunner, H. G., and M. A. van Driel, 2004. From syndrome families to functional genomics. Nat. Rev. Genet. 5: 545–551. - PubMed
    1. Drummond, D. A., A. Raval and C. O. Wilke, 2006. A single determinant dominates the rate of yeast protein evolution. Mol. Biol. Evol. 23: 327–337. - PubMed
    1. Dudley, A., D. Janse, A. Tanay, R. Shamir and G. Church, 2005. A global view of pleiotropy and phenotypically derived gene function in yeast. Mol. Syst. Biol. 1: 2005.0001. - PMC - PubMed

Publication types

MeSH terms

Substances