. 2006 May 23;103(21):8185-90.
doi: 10.1073/pnas.0602548103. Epub 2006 May 15.

High-resolution video monitoring of hematopoietic stem cells cultured in single-cell arrays identifies new features of self-renewal

Affiliations

High-resolution video monitoring of hematopoietic stem cells cultured in single-cell arrays identifies new features of self-renewal

Brad Dykstra et al. Proc Natl Acad Sci U S A. .

Abstract

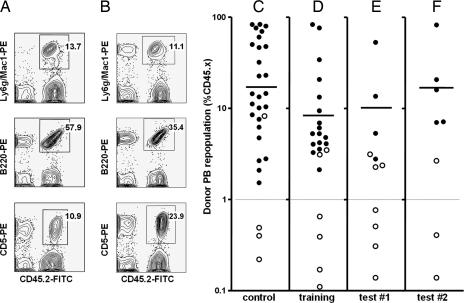
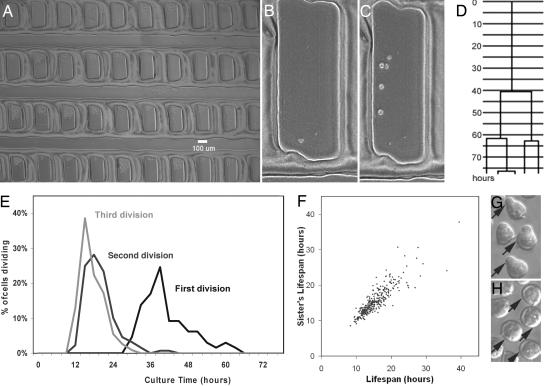
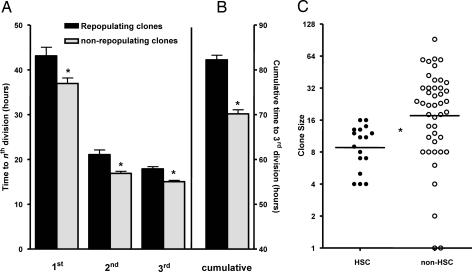
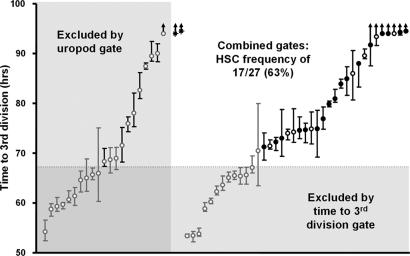
To search for new indicators of self-renewing hematopoietic stem cells (HSCs), highly purified populations were isolated from adult mouse marrow, micromanipulated into a specially designed microscopic array, and cultured for 4 days in 300 ng/ml Steel factor, 20 ng/ml IL-11, and 1 ng/ml flt3-ligand. During this period, each cell and its progeny were imaged at 3-min intervals by using digital time-lapse photography. Individual clones were then harvested and assayed for HSCs in mice by using a 4-month multilineage repopulation endpoint (>1% contribution to lymphoid and myeloid lineages). In a first experiment, 6 of 14 initial cells (43%) and 17 of 61 clones (28%) had HSC activity, demonstrating that HSC self-renewal divisions had occurred in vitro. Characteristics associated with HSC activity included longer cell-cycle times and the absence of uropodia on a majority of cells within the clone during the final 12 h of culture. Combining these criteria maximized the distinction of clones with HSC activity from those without and identified a subset of 27 of the 61 clones. These 27 clones included all 17 clones that had HSC activity; a detection efficiency of 63% (2.26 times more frequently than in the original group). The utility of these characteristics for discriminating HSC-containing clones was confirmed in two independent experiments where all HSC-containing clones were identified at a similar 2- to 3-fold-greater efficiency. These studies illustrate the potential of this monitoring system to detect new features of proliferating HSCs that are predictive of self-renewal divisions.


Conflict of interest statement

Conflict of interest statement: No conflicts declared.

Figures

Fig. 1.
Fig. 1.
In vivo repopulation characteristics of single CD45midlinRhoSP cells or their clonal progeny. (A) Representative FACS profiles from a mouse repopulated with a single CD45midlinRhoSP cell. (B) Representative FACS profiles from a mouse repopulated with the in vitro progeny of a single CD45midlinRhoSP cell cultured for 4 days in an array chamber. (C) Proportion of peripheral blood (PB) leukocytes produced from a single freshly isolated CD45midlinRhoSP cell transplanted 16 weeks previously. Filled circles identify mice in which the level of donor-type leukocytes indicated that at least one HSC was present in the clone injected (>1% donor-type leukocytes at 16 weeks and >1% of both lymphoid and myeloid cells present at some point during the period the mice were serially monitored). Open circles represent mice in which some donor leukocytes could be detected at 16 weeks (>0.1%), but these were either <1% of the total and/or had not shown all lineages to have been included in the cells produced. Mice showing no (<0.1%) repopulation by donor-type cells are not shown. Horizontal bars show the geometric-mean size of the clones produced in vivo from the injected HSCs of HSC-containing clones. (DF) Proportion of donor-type leukocytes seen in the PB of mice injected 16 weeks previously with a 4-day clone derived from a single CD45midlinRhoSP cell in the first imaging experiment (D) and in the second two experiments (E and F).
Fig. 2.
Fig. 2.
Description of the high-resolution time-lapse array system and representative culture results. (A) A digital image of an array showing 40 silicone microwells, each capable of holding up to ≈150 cells that can be tracked simultaneously. (B) Higher-power view of a representative well containing one CD45midlinRhoSP cell suspended in serum-free medium plus 300 ng/ml Steel factor, 20 ng/ml IL-11, and 1 ng/ml Flt-3 ligand. (C) Close-up of the well shown in B after 4 days at 37°C. (D) The pedigree diagram of the clone that developed in the well shown in C, illustrating the precision with which sequential cell divisions could be timed. (E) Cell-cycle time histogram of 67 individually cultured CD45midlinRhoSP cells. A delayed initial cell cycle was observed, followed by synchronously maintained subsequent divisions. Cells that did not complete the corresponding cell cycle were excluded from this histogram. (F) Comparison of the cell-cycle times of individual progeny pairs, demonstrating the pronounced synchrony retained between such “sister” cells, despite the wide range of cycle times observed. Cells whose sisters did not complete the corresponding cell cycle were not included in the plot. (G) Example of part of a clone in which many cells have large trailing projections (uropodia). Arrows indicate cells with uropodia. (H) Example of part of a clone in which very few cells have uropodia.
Fig. 3.
Fig. 3.
HSC activity is associated with smaller clone sizes and longer cell-cycle times. (A) Duration of the first, second, and third cell cycles was significantly longer in clones containing HSCs than in clones without HSCs. Cells that did not complete a first, second, or third cell cycle were excluded from this analysis. (B) The cumulative time to a third division of cells in HSC-containing clones was significantly longer than the corresponding value for clones without HSCs. Clones in which there were fewer than three cell divisions but the cells remained viable until the end of culture were assigned a time to third division equal to the total culture time. Error bars represent SEM, n = 67. (C) Comparison of 4-day clone size distributions for those that contained HSCs and those that did not. Horizontal bars indicate the geometric-mean values that are significantly different (P < 0.005). On average, clones with HSCs executed one fewer division over the 4 days than clones that did not contain HSCs.
Fig. 4.
Fig. 4.
Use of behavioral parameters defined by cell tracking to predict HSC-containing clones. Circles indicate the mean time to a third division in each clone. Bars indicate the ranges of these times. Arrows indicate that one or more of the cells did not complete a third division by the end of the culture period. Asterisks indicate wells in which the original cell had not yet divided at 96 h, when the cultures were terminated. Filled circles represent clones that contained a detectable HSC, and open circles represent clones that did not. Gray symbols represent clones that were excluded by one or both of the two criteria applied (i.e., the average time to a third division was <67.23 h and/or >50% of cells within the clone displayed uropodia during the final 12 h of culture). Filled symbols identify the 27 clones that were not excluded by either criteria (i.e., the fastest time to a third division was >67.23 h and ≤50% of cells within the clone displayed uropodia during the final 12 h of culture). The latter allowed the frequency of HSC-containing clones in the remainder to be increased from 28% to 63%, a 2.26-fold increase.

References

    1. Schwobel W. Mikroskopie. 1952;7:115–120. - PubMed
    1. Schrek R., Ott J. N., Jr Am. Med. Assoc. Arch. Pathol. 1952;53:363–378. - PubMed
    1. Kramis N. J. J. Biol. Photogr. Assoc. 1956;24:27–29. - PubMed
    1. Siskin J. In: Cinemicrography Cell Biology. Rose G. G., editor. New York: Academic; 1963. pp. 143–168.
    1. Allen R. D., Zacharski L. R., Widirstky S. T., Rosenstein R., Zaitlin L. M., Burgess D. R. J. Cell Biol. 1979;83:126–142. - PMC - PubMed

Publication types

Substances