

Failing to deactivate: resting functional abnormalities in autism
- PMID: 16702548
- PMCID: PMC1472462
- DOI: 10.1073/pnas.0600674103
Failing to deactivate: resting functional abnormalities in autism
Abstract
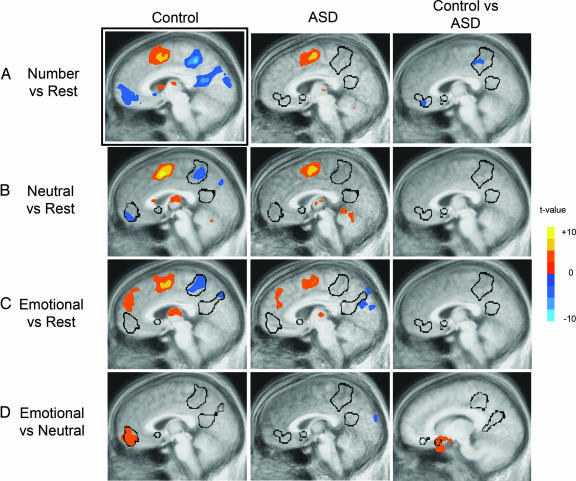
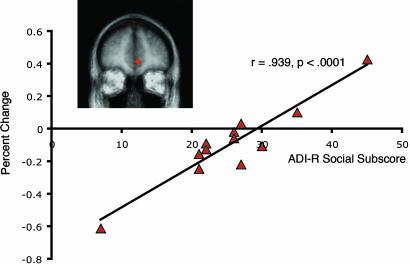
Several regions of the brain (including medial prefrontal cortex, rostral anterior cingulate, posterior cingulate, and precuneus) are known to have high metabolic activity during rest, which is suppressed during cognitively demanding tasks. With functional magnetic resonance imaging (fMRI), this suppression of activity is observed as "deactivations," which are thought to be indicative of an interruption of the mental activity that persists during rest. Thus, measuring deactivation provides a means by which rest-associated functional activity can be quantitatively examined. Applying this approach to autism, we found that the autism group failed to demonstrate this deactivation effect. Furthermore, there was a strong correlation between a clinical measure of social impairment and functional activity within the ventral medial prefrontal cortex. We speculate that the lack of deactivation in the autism group is indicative of abnormal internally directed processes at rest, which may be an important contribution to the social and emotional deficits of autism.
Conflict of interest statement
Conflict of interest statement: No conflicts declared.
Figures
References
-
- Gusnard D. A., Raichle M. E. Nat. Rev. Neurosci. 2001;2:685–694. - PubMed
-
- Maddock R. J. Trends Neurosci. 1999;22:310–316. - PubMed
-
- Northoff G., Bermpohl F. Trends Cognit. Sci. 2004;8:102–107. - PubMed
-
- Ochsner K. N., Beer J. S., Robertson E. R., Cooper J. C., Gabrieli J. D., Kihsltrom J. F., D'Esposito M. NeuroImage. 2005;28:797–814. - PubMed
Publication types
MeSH terms
Grants and funding
LinkOut - more resources
Full Text Sources
Medical
