Review
. 2006;17(1-2):71-97.
doi: 10.1515/revneuro.2006.17.1-2.71.

The boundary vector cell model of place cell firing and spatial memory

Affiliations
Review

The boundary vector cell model of place cell firing and spatial memory

Caswell Barry et al. Rev Neurosci. 2006.

Abstract

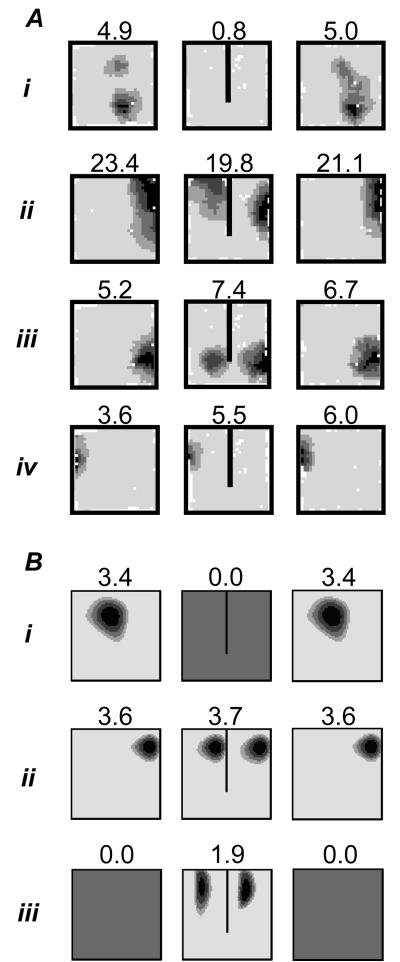
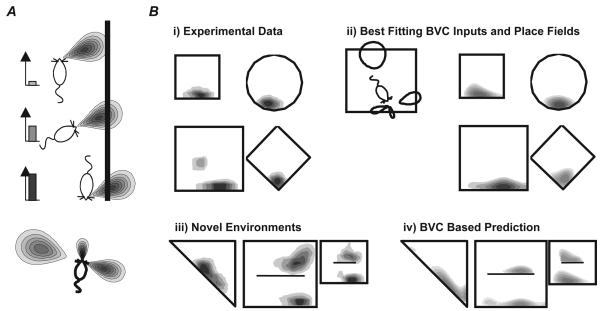
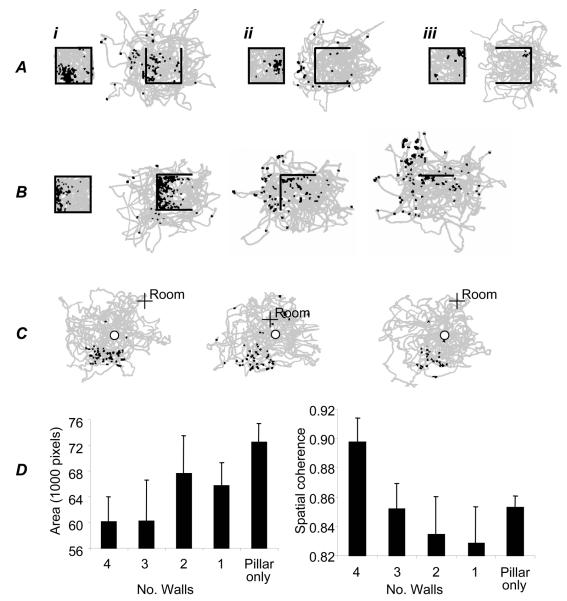
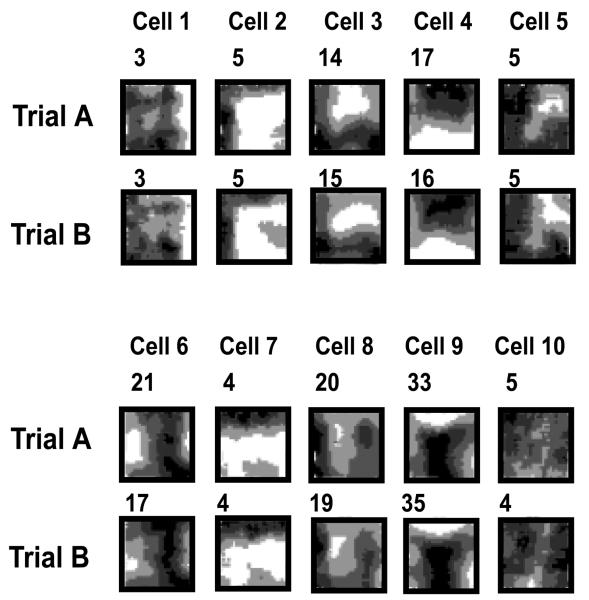
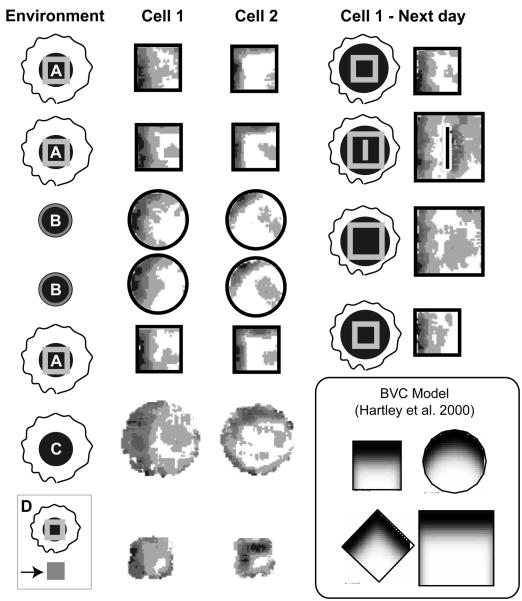
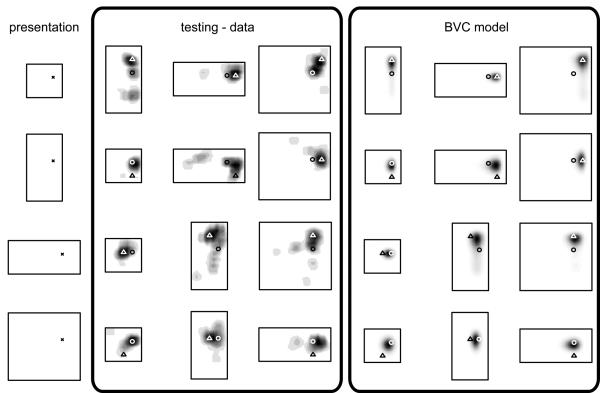
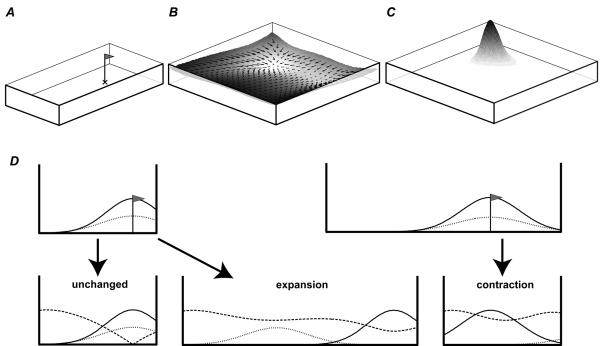
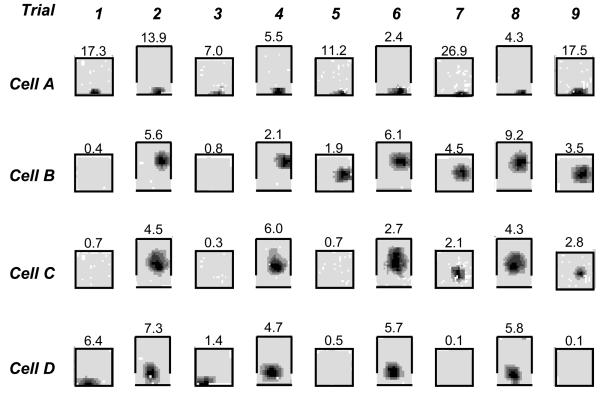
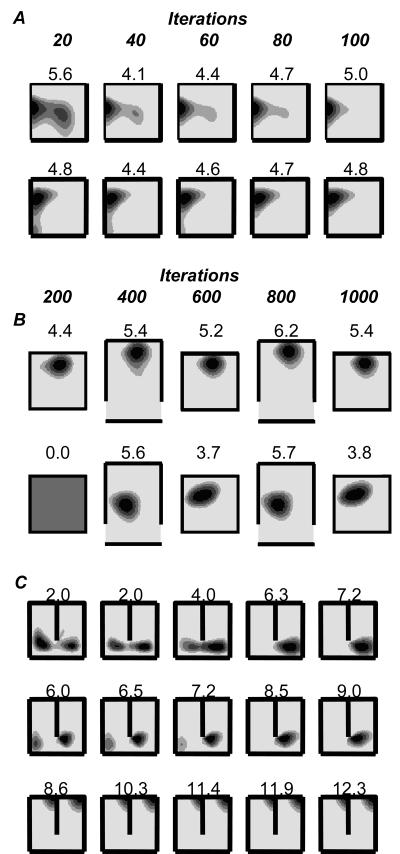
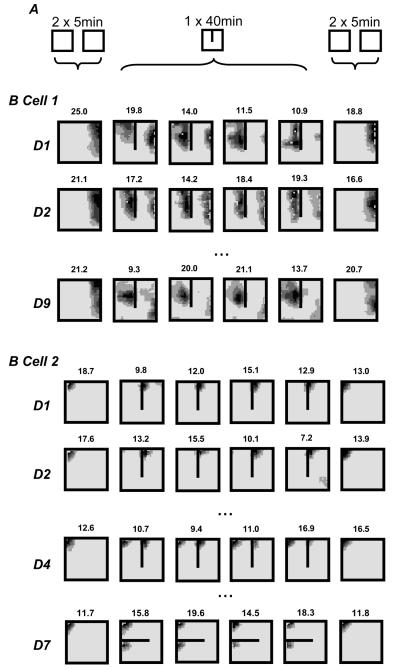
We review evidence for the boundary vector cell model of the environmental determinants of the firing of hippocampal place cells. Preliminary experimental results are presented concerning the effects of addition or removal of environmental boundaries on place cell firing and evidence that boundary vector cells may exist in the subiculum. We review and update computational simulations predicting the location of human search within a virtual environment of variable geometry, assuming that boundary vector cells provide one of the input representations of location used in mammalian spatial memory. Finally, we extend the model to include experience-dependent modification of connection strengths through a BCM-like learning rule - the size and sign of strength change is influenced by historic activity of the postsynaptic cell. Simulations are compared to experimental data on the firing of place cells under geometrical manipulations to their environment. The relationship between neurophysiological results in rats and spatial behaviour in humans is discussed.


Figures

Figure 1
Figure 1
Effect of barrier insertion on real and simulated place fields. A. Place fields of 4 place cells (i-iv) in three successive trials in a 65cm square walled environment. First column: 10 minute first trial. Second column: first 10 minutes of 40 minute second trial, after the insertion of a 40cm barrier. Third column: final 10 minute trial, barrier removed. Three outcomes inserting a barrier are illustrated: (i) inhibition of firing; (ii-iii) doubling of field with duplicate on either side of the barrier (the most common outcome); (iv) firing unaffected by the barrier (less common). B. Three simulated place fields from the Boundary Vector Cell (BVC) model in 65cm square environments with and without the 40cm barrier. Similar outcomes to experimental fields i-iii are illustrated: inhibition of firing (i); doubling of existing field in presence of barrier (ii, the most common outcome); double place field induced by presence of the barrier (iii). Here and below, plots shows firing rate as a function of the rat's location while it explores for randomly scattered food. These are calculated as the number of spikes divided by the animal's dwell time in each bin of a 64×64 spatial grid, and smoothed with a 5×5 kernel. Peak rate (Hz) is indicated by the value above the plot and corresponds to the area shaded black. Each gradation represents 20% of the peak.
Figure 2
Figure 2
The Boundary Vector Cell (BVC) Model. A. A BVC responds to the presence of a boundary at a preferred distance and (allocentric) direction. Its firing rate (bar charts on left) decreases as a boundary's distances and direction differs from the preferred values. The tuning to distance is shaper for shorter distances (bottom). B. i) Place fields from the same place cell recorded in different shaped environments. ii) Simulation of the place cell's firing in the 4 shapes using 4 BVC inputs (BVCs shown on the left). iv) Predicted firing of modelled place cell in 3 new shapes. iii) Observed firing of actual place cell in 3 new shapes. (Adapted from (// and //)
Figure 3
Figure 3
Effect of wall removal on place cell firing. A. Effect of removing one wall. Three place cells are shown (i-iii). Plots show the locations at which spikes were fired (black squares) and the path of the rat (grey). Walls are shown as black lines. B. Effect of successive removal of walls on the firing of one place cell. Removal of the first wall produced limited change in the place field – three surrounding walls were sufficient to support spatial firing. Removal of the second wall, however, caused a profound break down in spatial firing. C. A rare place cell (one of two) with a coherent field in the pillar-only condition (after removal of all 4 walls). The location of the pillar is shown by ‘o’, a fixed point within the room is shown by ‘+ Room’. D. Effect of successive wall removal on 17 place fields: they increase in area (left: Kilo-pixels above half of the peak firing rate, entire camera view is 262Kpix) and decrease in spatial coherence (right, see //, note that evenly scattered low firing produces high coherence).
Figure 4
Figure 4
Firing rate maps of ten simultaneously-recorded dorsal subicular neurons in two trials in a square-walled environment. Cells 2, 6, 7, 8 and 9 show Boundary Vector Cell-like locational fields. The number at the top left of each firing rate map indicates the peak firing rate (Hz).
Figure 5
Figure 5
Geometry-dependent firing of potential subicular Boundary Vector Cells in response to extreme environmental manipulation. Left: Firing rate maps of two fields in four environments (A:curtained-off square walls; B: un-curtained with cylindrical walls of different material; C: no walls –boundary is a sheer drop; D on the small square holding platform – boundary is a sheer drop). Right: further testing of cell 1 in small and large square environments, including one with a barrier (in which cell shows doubled field). See main text for details. Trials are shown in order of testing (from top to bottom). Firing rate maps for open platform environments C and D include regions where the rats peer over the edges of the platform. Inset: Example of predicted BVC firing rate maps adapted from //).
Figure 6
Figure 6
Density of responses from a human spatial memory task (‘testing – data’) and prediction from simulation using BVC model (‘BVC model’). Human data (adapted from Hartley, Trinkler and Burgess //) – shows effects of geometric changes of the environment on response locations. The left column shows the location of a golf flag (X) in each of four virtual presentation environments. Subjects were briefly removed from the environment and then asked to place a marker at the cued location (the golf flag having been removed). On some trials the shape and size of the environment was changed during their absence. Response densities after changes of environmental shape are indicated by grey level. Some responses preserve fixed distances from the nearer walls (indicated by triangles), or the ratio of distances across the environment (circles). The final three columns show simulated density of responses corresponding to the experimental data, see main text.
Figure 7
Figure 7
BVC model of spatial memory. A. Cue location in presentation environment (marked by X). B. Surface showing the net difference in activity of a BVC population from that stored at the cue location in the presentation environment, as the subject moves around (using a Euclidean distance metric). Following the gradient of this surface leads back to the cue location, where the net change is minimized. C. The Softmax function is used to model the probability of a response at a given location given the difference in activity. D Above: BVCs firing at the cue location in a 1-D environment can be divided into those responding to East/left (net firing shown as dotted line) or West/right (net firing shown as solid line). This is shown for a small (i) and large (ii) presentation environment. Note the effect of proximity-weighting due to more sharply tuned (and more numerous) short range BVCs. Below: Dashed line shows the net difference in the firing of both populations from that at the cue location in the presentation environment as a function of the subject's location within the testing environment (using a Euclidean distance metric). The minimum of the dashed line shows the location of peak response: correct in an unchanged environment (left), maintaining a fixed distance to the nearer wall after environmental expansion (i -> middle), maintaining a fixed ration of distance between walls after environmental contraction (ii –> right). In contractions, the net change in activity from that at the stored location (dashed line), although strongly influenced by inputs tuned to the East wall (which was nearer at presentation), is also strongly influenced by increased firing in BVCs with short range tuning to the West wall which were inactive at the cue location (not shown).
Figure 8
Figure 8
Place fields recorded from four cells (A-D) over 9 trials, alternating between a closed square (65cm) environment and the same environment with the south wall moved out by 25cm. Trials in the square environment lasted 5 minutes, those in the open rectangle 15 minutes. When active, fields from the same cell occupied analogous positions in both conditions, consistent with the BVC model. Cell A fired continually throughout the session. Cells B-D exhibited experience-dependent plasticity: firing in the square starting (Cells B,C) or stopping after repeated exposure to the open rectangle.
Figure 9
Figure 9
Plasticity in the extended BVC model. Seven simulated cells are shown (one per row) after different amounts of learning (columns). A. Two place fields in an unchanging square (65cm) environment. Each column corresponds to 20 additional iterations of learning with the BCM rule, see main text for details. The fields are gradually ‘tidied up’. We also observed fields that remained unchanged after learning (not shown). B. Two place fields in alternating square (65cm) and open rectangle (90cm × 65cm) environments. Each column corresponds to an additional 200 iterations of BCM learning. The first place field maintains its position relative to the adjacent north wall in both environments. The second starts to fire in the square environment after exposure to the open rectangle, maintaining its position relative to the south wall. C. Simulated firing, learning was conducted in an unchanging environment (65 cm square with 40cm barrier). Again, each column represents 200 iterations. All cells initially exhibit double fields in the presence of the barrier. The first two cells progressively lost one of their fields with learning. The third cell essentially remained unchanged.
Figure 10
Figure 10
Firing rate maps from 2 place cells simultaneously recorded over several days (one per row) in the 65cm square enclosure with or without a 40cm North-South barrier. Each plot represents 10 minutes of exploration. The first column shows combined firing from 2, 5 minute trials recorded without a barrier. The next 4 columns show firing from a single continuous 40 minute trial (as 4 × 10 minute slices) in the presence of the barrier. The final column shows firing with the barrier removed. Cell 1 doubles its field when the barrier is introduced on day 1, while the Eastern field is gradually lost both within each day and over days, see main text. Cell 2 fired only on one side of the barrier for the first 3 days, then developed a field on both sides on day 4 and continued to do so on subsequent days (not shown), including in an East-West barrier configuration (day 7).

References

    1. O'Keefe J, Dostrovsky J. The hippocampus as a spatial map. Preliminary evidence from unit activity in the freely-moving rat. Brain Res. 1971;34:171–175. - PubMed
    1. O'Keefe J. Place units in the hippocampus of the freely moving rat. Exp Neurol. 1976;51:78–109. - PubMed
    1. Bliss TV, Lomo T. Long-lasting potentiation of synaptic transmission in the dentate area of the anaesthetized rabbit following stimulation of the perforant path. J Physiol. 1973;232:331–356. - PMC - PubMed
    1. Burwell RD, Witter MP, Amaral DG. Perirhinal and postrhinal cortices of the rat: a review of the neuroanatomical literature and comparison with findings from the monkey brain. Hippocampus. 1995;6:390–408. - PubMed
    1. Scoville WB, Milner B. Loss of recent memory after bilateral hippocampal lesions. J Neurol Neurosurg Psychiatry. 1957;20:11–21. - PMC - PubMed

Publication types