. 2006 Sep 1;108(5):1724-32.
doi: 10.1182/blood-2006-03-009910. Epub 2006 May 16.

Frequent gain of chromosome band 1q21 in plasma-cell dyscrasias detected by fluorescence in situ hybridization: incidence increases from MGUS to relapsed myeloma and is related to prognosis and disease progression following tandem stem-cell transplantation

Affiliations

Frequent gain of chromosome band 1q21 in plasma-cell dyscrasias detected by fluorescence in situ hybridization: incidence increases from MGUS to relapsed myeloma and is related to prognosis and disease progression following tandem stem-cell transplantation

Ichiro Hanamura et al. Blood. .

Abstract

Using fluorescence in situ hybridization we investigated amplification of chromosome band 1q21 (Amp1q21) in more than 500 untreated patients with monoclonal gammopathy of undetermined significance (MGUS; n = 14), smoldering multiple myeloma (SMM; n = 31), and newly diagnosed MM (n = 479) as well as 45 with relapsed MM. The frequency of Amp1q21 was 0% in MGUS, 45% in SMM, 43% in newly diagnosed MM, and 72% in relapsed MM (newly diagnosed versus relapsed MM, P < .001). Amp1q21 was detected in 10 of 12 patients whose disease evolved to active MM compared with 4 of 19 who remained with SMM (P < .001). Patients with newly diagnosed MM with Amp1q21 had inferior 5-year event-free/overall survival compared with those lacking Amp1q21 (38%/52% versus 62%/78%, both P < .001). Thalidomide improved 5-year EFS in patients lacking Amp1q21 but not in those with Amp1q21 (P = .004). Multivariate analysis including other major predictors revealed that Amp1q21 was an independent poor prognostic factor. Relapsed patients who had Amp1q21 at relapse had inferior 5-year postrelapse survival compared with those lacking Amp1q21 at relapse (15% versus 53%, P = .027). The proportion of cells with Amp1q21 and the copy number of 1q21 tended to increase at relapse compared with diagnosis. Our data suggest that Amp1q21 is associated with both disease progression and poor prognosis.


Figures

Figure 1.
Figure 1.
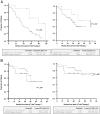
Incidence and rates of remission and EFS and OS based on the presence or absence of Amp1q21. (A) The proportion of cases within the group with no Amp1q21 (n = 267) and Amp1q21 (n = 201) achieving CR or nCR is plotted over time. (B) A Kaplan-Meier analysis of EFS (left) and OS (right) is displayed in relation to no Amp1q21 (n = 274) or Amp1q21 (n = 205). CI indicates confidence interval.
Figure 2.
Figure 2.
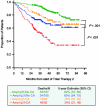
EFS and OS among patients with newly diagnosed MM according to Amp1q21 and adding thalidomide or not. A Kaplan-Meier analysis of EFS (left) and OS (right) is displayed in relation to no Amp1q21 (up to 2 copies of 1q21, n = 124) or Amp1q21 (3 or more copies of 1q21, n = 102) in patients treated with a regimen containing thalidomide and in relation to no Amp1q21 (n = 150) or Amp1q21 (n = 103) in patients treated with a regimen without thalidomide. Thal+ indicates patients treated with thalidomide; Thal-, patients treated without thalidomide.
Figure 3.
Figure 3.
EFS and OS among patients with newly diagnosed MM according to the presence or absence of common recurrent translocations and Amp1q21. A Kaplan-Meier analysis of EFS (left) and OS (right) in patients with MMSET spikes (A) or CCND1 spikes (B) according to the presence or absence of Amp1q21. Note that the difference in median follow-up of this group of patients is different from the overall group because microarray profiling was initiated after Total Therapy 2 had started.
Figure 4.
Figure 4.
OS among patients with newly diagnosed MM according to cytogenetic abnormalities and Amp1q21. A Kaplan-Meier analysis of OS in 440 patients who had both 1q21 FISH results and karyotype data by G banding according to the presence or absence of cytogenetic abnormalities and Amp1q21.
Figure 5.
Figure 5.
The proportion of cells with Amp1q21 at diagnosis and relapse. The proportion of cells with Amp1q21 is indicated by the height of the bar on the y-axis. The proportion of cells with 3 and with 4 or more copies of 1q21 in each sample is indicated by blue and red, respectively. A total of 479 newly diagnosed MM and 45 relapsed MM samples are ordered from the lowest to highest proportion of cells with Amp1q21 from left to right in each group on the x-axis. The mean/median percentages of cells with Amp1q21 at diagnosis and relapse were 36%/65% and 7%/88%, respectively.
Figure 6.
Figure 6.
The proportion of cells with Amp1q21 and the copy number of 1q21 in each patient at diagnosis and relapse in paired patients. Twenty-eight patients had 1q21 FISH results available at both diagnosis and relapse. The proportion of cells with Amp1q21 is indicated by the height of the bar on the y-axis. Each sample is represented by a left and right bar indicating the proportion of cells with Amp1q21 at diagnosis and relapse, respectively. The proportion of cells with 3 and with 4 or more copies of 1q21 in each sample is indicated by blue and red, respectively. The numbers below each patient number indicate the copy number of 1q21 at diagnosis and relapse. Sample ID is same as that in Table S4.
Figure 7.
Figure 7.
Postrelapse survival of MM patients enrolled in Total Therapy 2 according to Amp1q21 and the copy number of 1q21 at relapse. Kaplan-Meier analysis of postrelapse survival is shown in relation to no Amp1q21 (up to 2 copies of 1q21, n = 12) or Amp1q21 (3 or more copies of 1q21, n = 33) at relapse (top) and up to 2 copies (n = 12), 3 copies (n = 13), or 4 or more copies (n = 20) of 1q21 at relapse (bottom) determined by interphase FISH. At the time of analysis, the median follow-up of a postrelapse survival was 17 months (range, 0.3 to 78) in this analysis.

References

    1. Barlogie B, Kyle RA, Anderson KC, et al. Standard chemotherapy compared with high-dose chemoradiotherapy for multiple myeloma: final results of phase III US Intergroup Trial S9321. J Clin Oncol. 2006;24: 929-936. - PubMed
    1. Barlogie B, Shaughnessy J, Tricot G, et al. Treatment of multiple myeloma. Blood. 2004;103: 20-32. - PubMed
    1. Attal M, Harousseau JL, Facon T, et al. Single versus double autologous stem-cell transplantation for multiple myeloma. N Engl J Med. 2003; 349: 2495-2502. - PubMed
    1. Moreau P, Hullin C, Garban F, et al. Intergroupe Francophone du Myelome group. Tandem autologous stem cell transplantation in high-risk de novo multiple myeloma: final results of the prospective and randomized IFM 99-04 protocol. Blood. 2006;107: 397-403. - PubMed
    1. Avet-Loiseau H, Facon T, Daviet A, et al. 14q32 translocations and monosomy 13 observed in monoclonal gammopathy of undetermined significance delineate a multistep process for the oncogenesis of multiple myeloma. Intergroupe Francophone du Myelome. Cancer Res. 1999;59: 4546-4550. - PubMed

Publication types