Comparative Study
. 2006 May-Jun;13(3):287-97.
doi: 10.1101/lm.84406. Epub 2006 May 16.

Do rats use shape to solve "shape discriminations"?

Affiliations
Comparative Study

Do rats use shape to solve "shape discriminations"?

Loredana Minini et al. Learn Mem. 2006 May-Jun.

Abstract

Visual discrimination tasks are increasingly used to explore the neurobiology of vision in rodents, but it remains unclear how the animals solve these tasks: Do they process shapes holistically, or by using low-level features such as luminance and angle acuity? In the present study we found that when discriminating triangles from squares, rats did not use shape but instead relied on local luminance differences in the lower hemifield. A second experiment prevented this strategy by using stimuli-squares and rectangles-that varied in size and location, and for which the only constant predictor of reward was aspect ratio (ratio of height to width: a simple descriptor of "shape"). Rats eventually learned to use aspect ratio but only when no other discriminand was available, and performance remained very poor even at asymptote. These results suggest that although rats can process both dimensions simultaneously, they do not naturally solve shape discrimination tasks this way. This may reflect either a failure to visually process global shape information or a failure to discover shape as the discriminative stimulus in a simultaneous discrimination. Either way, our results suggest that simultaneous shape discrimination is not a good task for studies of visual perception in rodents.


Figures
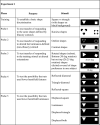
Figure 1.
Figure 1.
Summary of the training phases and stimuli used in Experiment 1. For Probe 3, the two stimulus sets are shown between which performance for one rat switched its preference from one shape to the other. The big change in behavior for such an apparently trivial stimulus change suggested that the animal might be using a local luminance-based strategy.
Figure 2.
Figure 2.
(A) The group learning curve (means ±SEM) for training on the square-triangle discrimination (Experiment 1). (B) Individual transfer test performance (means ±SEM) on the Kanizsa and Outline stimuli. For illustrative purposes the Outlines’ stimuli in the graph are shown with reversed contrast polarity. The animals successfully transferred performance to the Outline stimuli but fell to chance or below for the Kanizsa stimuli. That this decrement may have been due to the reversal in contrast polarity is illustrated by the two rats shown in panel C, in which performance also fell to chance when the solid shapes were reversed.
Figure 3.
Figure 3.
Individual (A) and group (B) performance with the stimuli testing the use of lower hemifield features. The preference for the negative shape can be clearly seen in the RD trials. (C) (For illustrative purposes the contrast polarity of the stimuli has been reversed.) (Left) The Reflected-square stimuli showing the level (upper dotted line) below which both stimuli possess equal area. It was hypothesized that the rats compared the shapes only below this 40-mm level, which thus constitutes the upper boundary of the lower hemifield. (Right) The DispSq stimuli. When the square was elevated to the level shown, the areas of the shapes that lay within the critical lower hemifield (between the dotted lines) were now reversed, the triangle having a greater area than the square. As predicted, this caused a reversal of the rats’ choice preferences (see panel D; especially rat 4). Individual (D) and group (E) performance with the stimuli testing the use of lower hemifield luminance. Error bars indicate the standard errors. The performance of rats when the square was elevated as described in panel C was at or considerably below chance, confirming that the subjects used area rather than shape to make the discrimination. When both shapes were displaced, the rats were also poor at discriminating, suggesting that their looking was guided by a touchscreen-based frame of reference rather than a shape-based one. Interestingly, when the luminance of the square in the critical region was reduced by dimming the shape rather than elevating it, performance remained high. Thus, although area is clearly a factor in the discrimination, this may be assessed on the basis of number of pixels rather than total brightness.
Figure 4.
Figure 4.
Summary of the training phases and illustrative examples of the stimuli used in Experiment 2. The Unidimensional Discrimination (UD) animals were divided into UDV, in which the stimuli differed only in the vertical dimension, and UDH in which they only differed in the horizontal dimension. The UD animals alone received probe tests to find out how they were making the discrimination.
Figure 5.
Figure 5.
(A) Learning curves for the Bidimensional (BD) and Unidimensional (UD) groups. The graph illustrates performance up to criterion for the UD group and just before the testing phase for the BD group. Error bars indicate the standard errors. Individual (B) and group (C) performance in the three probes. (Arrows) Introduction of additional stimuli into the training sets. For the UD rats, stimuli of altered luminance were added after session 13 to discourage use of simple brightness as a discriminand. For the BD rats, intermediate-sized rectangles were added after session 18 to foil the use of an “avoid/choose extreme shapes” rule. Note that the rats fell back to chance at this point, suggesting they were indeed using a strategy other than shape to solve the task.

Similar articles

Cited by

References

    1. Bussey T., Muir J.L., Robbins T.W. A novel automated touchscreen procedure for assessing learning in the rat using computer graphic stimuli. Neurosci. Res. Commun. 1994;15:103–110.
    1. Bussey T.J., Saksida L.M., Rothblat L.A. Discrimination of computer-graphic stimuli by mice: A method for the behavioral characterization of transgenic and gene-knockout models. Behav. Neurosci. 2001;115:957–960. - PubMed
    1. Cook R.G., Geller A.I., Zhang G.R., Gowda R. Touchscreen-enhanced visual learning in rats. Behav. Res. Methods Instrum. Comput. 2004;36:101–106. - PubMed
    1. Fields P.E. Studies in concept formation. The development of triangularity by the white rat. Comparative Psychology Monographs. 1932;9:1–70.
    1. Gaffan E.A., Eacott M.J. A computer-controlled maze environment for testing visual memory in the rat. J. Neurosci. Methods. 1995;60:23–37. - PubMed

Publication types

LinkOut - more resources