. 2006 Jun;26(11):4172-84.
doi: 10.1128/MCB.00135-06.

Cathepsin L stabilizes the histone modification landscape on the Y chromosome and pericentromeric heterochromatin

Affiliations

Cathepsin L stabilizes the histone modification landscape on the Y chromosome and pericentromeric heterochromatin

Yaroslava A Bulynko et al. Mol Cell Biol. 2006 Jun.

Abstract

Posttranslational histone modifications and histone variants form a unique epigenetic landscape on mammalian chromosomes where the principal epigenetic heterochromatin markers, trimethylated histone H3(K9) and the histone H2A.Z, are inversely localized in relation to each other. Trimethylated H3(K9) marks pericentromeric constitutive heterochromatin and the male Y chromosome, while H2A.Z is dramatically reduced at these chromosomal locations. Inactivation of a lysosomal and nuclear protease, cathepsin L, causes a global redistribution of epigenetic markers. In cathepsin L knockout cells, the levels of trimethylated H3(K9) decrease dramatically, concomitant with its relocation away from heterochromatin, and H2A.Z becomes enriched at pericentromeric heterochromatin and the Y chromosome. This change is also associated with global relocation of heterochromatin protein HP1 and histone H3 methyltransferase Suv39h1 away from constitutive heterochromatin; however, it does not affect DNA methylation or chromosome segregation, phenotypes commonly associated with impaired histone H3(K9) methylation. Therefore, the key constitutive heterochromatin determinants can dynamically redistribute depending on physiological context but still maintain the essential function(s) of chromosomes. Thus, our data show that cathepsin L stabilizes epigenetic heterochromatin markers on pericentromeric heterochromatin and the Y chromosome through a novel mechanism that does not involve DNA methylation or affect heterochromatin structure and operates on both somatic and sex chromosomes.


Figures

FIG. 1.
FIG. 1.
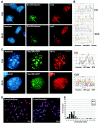
Mutually alternating distribution of H3me3K9 and H2A.Z on mammalian chromosomes is altered upon cathepsin L inactivation. (A) Immunofluorescence of metaphase chromosome spreads from mouse ES-derived fibroblasts (mouse ES) and human foreskin fibroblasts (human). Metaphase chromosomes were stained with antibodies against H3me3K9 (me3, red) and H2A.Z (green) as well as Hoechst 33258 DNA stain (blue). cen, centromeres. Arrows indicate the Y chromosome. Bar, 5 μm. (B) Fluorescence intensity profiles of H3me3K9, H2A.Z, and Hoechst plotted along the chromosome paths (indicated by yellow lines in panel A, subpanels b, d, f, and h). Note the “out-of-phase” chromosomal distribution of H2A.Z and H3me3K9 on both mouse and human chromosomes as well as accumulation of H3me3K9 on centromeric regions. (C) FISH of mouse metaphase chromosomes coupled with H3me3K9 fluorescence. Chromosomes were first stained with anti-H3me3K9 antibodies (red) and then subjected to FISH with Y-specific probe (green) and counterstained with Hoechst (blue). (D) H3me3K9 immunofluorescence on metaphase chromosomes from control cells (control) and cells expressing wild-type MENT (MENT-wt) and ov-swap MENT (MENT-ov16). (E) H3me3K9 immunofluorescence of interphase nuclei (subpanels a to c) and metaphase chromosomes (subpanels d to f) from cathepsin L heterozygous (CL+/−) and cathepsin L knockout (CL−/−) mouse embryonic fibroblasts. “Early” and “late” indicate passages of CL−/− cells (see text). Red, H3me3K9; blue, Hoechst. Asterisks indicate bands of H3me3K9 accumulation on MENT-wt chromosome arms. Cen, centromeres; Y, Y chromosome. Arrows on panel E point to pericentromeric chromatin. Profiles illustrate the spatial fluorescence intensity changes of H3me3K9 and Hoechst plotted along the paths shown by yellow lines. Note the accumulation of H3me3K9 in centromeric regions of control, MENT-ov16, CL+/−, and CL−/− “early” fibroblasts but not in MENT-wt or CL−/− “late” fibroblasts. Bar, 5 μm.
FIG. 2.
FIG. 2.
Epigenetic chromatin markers in cathepsin L knockout cells. (A) Frequency of H3me3K9 localization phenotypes on CL+/− (CL+/−) and CL−/− (CL−/− “early” and “late,” see text) chromosomes. H3me3K9 chromosomal distribution in randomly picked metaphase spreads (100 from each cell line) was assessed by immunofluorescence. The percentage of karyotypes with either centromeric (e.g., Fig. 1E, subpanels d and e) or noncentromeric (e.g., Fig. 1E, subpanel f) H3me3K9 in each culture is represented as a bar. Note the 100% centromeric H3me3K9 in CL+/− and CL−/− “early” and the prevalence of noncentromeric H3me3K9 in CL−/− “late.” (B to D) Nuclear proteins of CL−/− and CL+/− fibroblasts as well as NIH 3T3 (3T3), CLO-initial (CLOi), CLO3, and CLI cells were analyzed by sodium dodecyl sulfate-polyacrylamide gel electrophoresis (C) and Western blotting (B and D) with antibodies against H3me3K9, H3me2K9, H3acK9,14, H2A.Z, H4acK12, H4me3K20, HP1α, and HP1β as indicated. Equal amounts of nuclear protein in each well were confirmed by Coomassie blue R-250 staining (e.g., see panel C) and by Western blotting with antibody against H3 C terminus (H3 C-term). (E) Frequency of H3me3K9 level/localization phenotypes in CLI, CLOi, CLO3, and CLO6 cultures. H3me3K9 nuclear levels and distribution were assessed by immunofluorescence. Bars represent percentages of cells with either high-level centromeric or low-level noncentromeric H3me3K9. More than 200 nuclei were scored in each culture. Note that there was only one H3me3K9 phenotype in CLI, CLO3, and CLO6 cultures and the mixed population of CLOi.
FIG. 3.
FIG. 3.
Nuclear and chromosomal localization of epigenetic chromatin markers in CLI and CLO (CLO3) cells. (A) Immunofluorescence of chromatin markers in CLI (subpanels a to e) and CLO (subpanels f to j) cell nuclei. Cells were fixed and stained with antibodies against H3me3K9 (red, subpanels a, b, f, and g), HP1β (green, subpanels b and g), HP1α (red, subpanels d and i), H2A.Z (red, subpanels c and h), H4me3K20 (red, subpanels e and j) and counterstained with Hoechst 33258 (blue). Arrows point to the colocalization of epigenetic chromatin markers with pericentromeric heterochromatin (chromocenters) in CLI. Arrowheads indicate accumulation of H2A.Z on heterochromatin of CLO cells. (B) Immunofluorescence of chromosomes from CLI (a to d) and CLO (e to h) cells. Red, H3me3K9; green, H2A.Z; blue, Hoechst 33258; Y, Y chromosome. (C) FISH (green) coupled with H3me3K9 staining (red) of CLI and CLO chromosomes. Arrowheads point at the double FISH signals. Bars, 5 μm.
FIG. 4.
FIG. 4.
Suv39h1 expression and protein levels are similar in CLI and CLO cells. (A) RT-PCR analysis of total RNA from CLI and CLOi cells. Total RNA from logarithmically growing CLI and CLOi cells was isolated and analyzed by RT-PCR with oligonucleotides specific for Suv39h1 (upper panel) or beta-actin (lower panel) mRNA, as described in Materials and Methods. 1:5, cDNA from CLOi cells was diluted 5 times in a parallel experiment to ensure the sensitivity of PCR analysis. (B) Upper panel, Western blot analysis of total protein from CLI and CLOi cells with antibodies against mouse Suv39h1 protein. Numbers indicate molecular weight markers. Lower panel, the same membrane was stripped and stained with antibodies against beta-actin to confirm equal protein loading.
FIG. 5.
FIG. 5.
Suv39h1 relocation does not affect DNA methylation or chromosome segregation. (A) Immunofluorescence of CLI (upper row) and CLO (lower row) cells transfected with Xpress-Suv39h1 and stained with antibodies against Xpress (green), H3me3K9 (red), and Hoechst 33258 DNA stain (blue) 48 h after transfection. (B) Fluorescence intensity profiles illustrate spatial distribution of Xpress, me3, and Hoechst in the nuclei along the paths indicated by yellow lines on panel A. Note the colocalization of Xpress and H3me3K9 foci with Hoechst-positive chromocenters in CLI cells (arrows) but not CLO cells (arrowheads). Bar, 5 μm. (C) Cathepsin L knock-in (CLI) or knockout (CLO) cells were transfected with GFP-tagged Suv39h1, fixed, and stained with antibodies against HP1β 48 h after transfection (CLI, upper row; CLO, lower row). Blue, Hoechst 33258 DNA stain; green, GFP fluorescence; red, HP1β. Profiles indicate fluorescence intensity changes along the yellow lines. Note the almost complete correlation of GFP-Suv39h1 and HP1β signals with Hoechst foci in CLI cells (arrow) and the absence of any correlation between these markers in CLO cells. (D) 5-Methylcytosine (5-meC) immunofluorescence of metaphase chromosomes from CLI and CLOi cells. Chromosomes were stained with antibodies against 5-meCy (red) and counterstained with Hoechst (blue) as described in Materials and Methods. Note similar distribution of 5-meCy on centromeres (arrows) and the Y chromosome (Y). Bar, 5 μm. (E) Nondiploid chromosome number distribution in metaphase spreads from CLI (black) and CLOi (gray) cells. One hundred metaphase sets from each culture were randomly selected, and chromosomes were counted using Image Pro Plus software.

Similar articles

Cited by

References

    1. Al-Khunaizi, M., C. J. Luke, Y. S. Askew, S. C. Pak, D. J. Askew, S. Cataltepe, D. Miller, D. R. Mills, C. Tsu, D. Bromme, J. A. Irving, J. C. Whisstock, and G. A. Silverman. 2002. The serpin SQN-5 is a dual mechanistic-class inhibitor of serine and cysteine proteinases. Biochemistry 41:3189-3199. - PubMed
    1. Bannister, A. J., P. Zegerman, J. F. Partridge, E. A. Miska, J. O. Thomas, R. C. Allshire, and T. Kouzarides. 2001. Selective recognition of methylated lysine 9 on histone H3 by the HP1 chromo domain. Nature 410:120-124. - PubMed
    1. Barrett, A. J., and H. Kirschke. 1981. Cathepsin B, cathepsin H, and cathepsin L. Methods Enzymol. 80(Pt C):535-561. - PubMed
    1. Barton, S. C., K. L. Arney, W. Shi, A. Niveleau, R. Fundele, M. A. Surani, and T. Haaf. 2001. Genome-wide methylation patterns in normal and uniparental early mouse embryos. Hum. Mol. Genet. 10:2983-2987. - PubMed
    1. Bean, C. J., P. A. Hunt, E. A. Millie, and T. J. Hassold. 2001. Analysis of a malsegregating mouse Y chromosome: evidence that the earliest cleavage divisions of the mammalian embryo are non-disjunction-prone. Hum. Mol. Genet. 10:963-972. - PubMed

Publication types

MeSH terms

LinkOut - more resources