. 2006 Jun;26(11):4185-200.
doi: 10.1128/MCB.01055-05.

N-cadherin and keratinocyte growth factor receptor mediate the functional interplay between Ki-RASG12V and p53V143A in promoting pancreatic cell migration, invasion, and tissue architecture disruption

Affiliations

N-cadherin and keratinocyte growth factor receptor mediate the functional interplay between Ki-RASG12V and p53V143A in promoting pancreatic cell migration, invasion, and tissue architecture disruption

Therese B Deramaudt et al. Mol Cell Biol. 2006 Jun.

Abstract

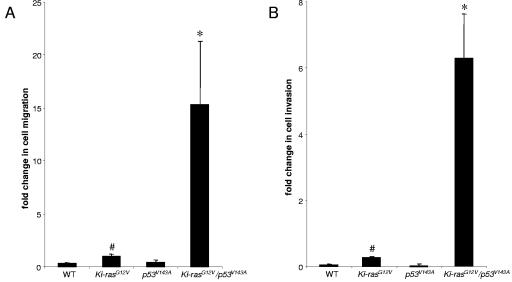
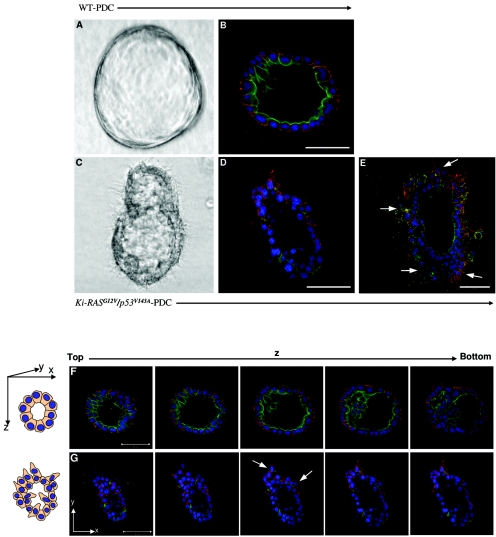
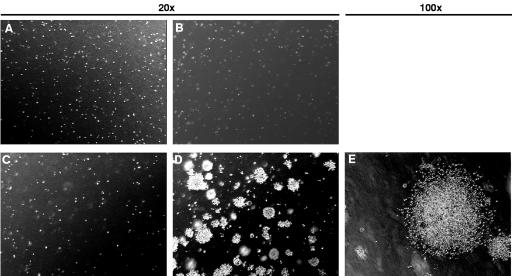
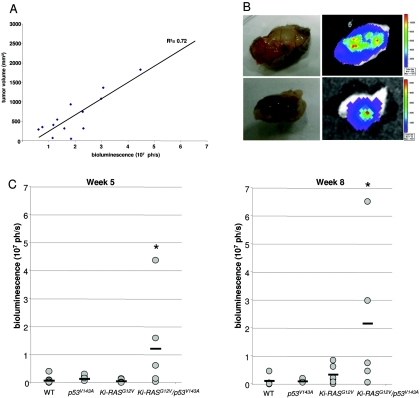
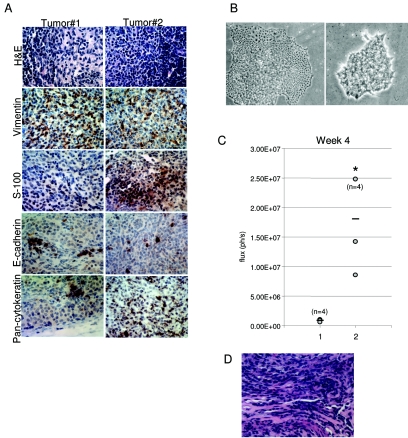
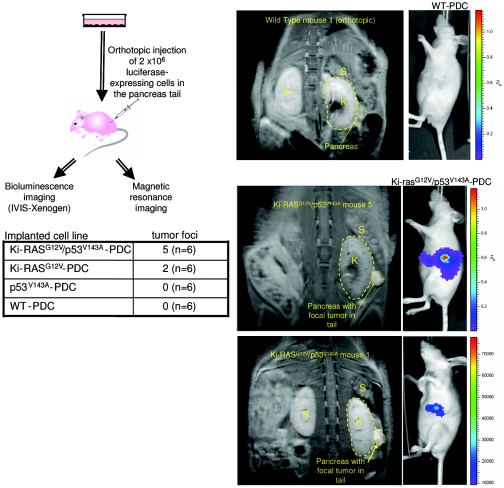
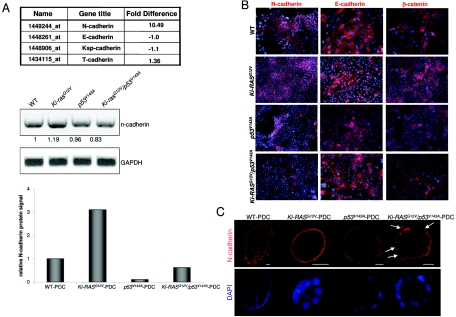
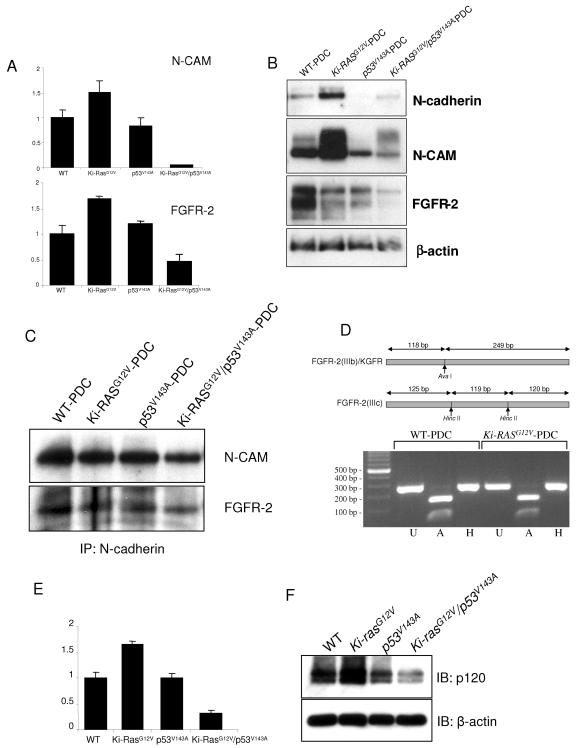
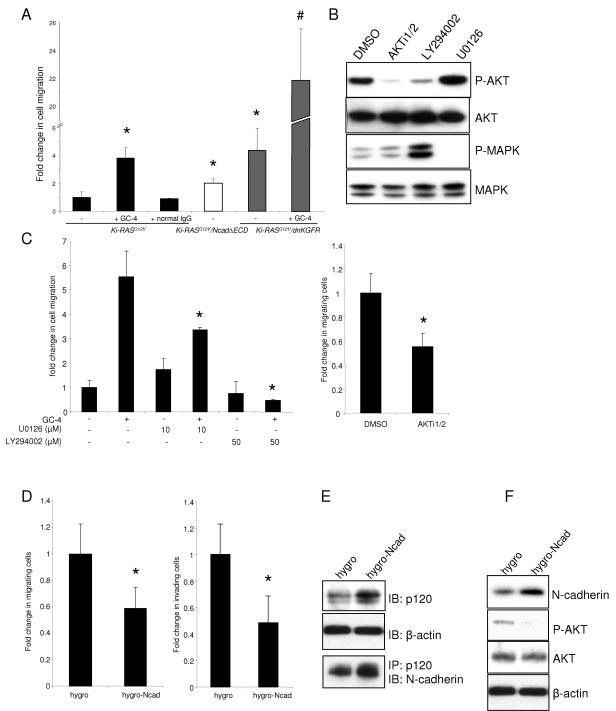
The genetic basis of pancreatic ductal adenocarcinoma, which constitutes the most common type of pancreatic malignancy, involves the sequential activation of oncogenes and inactivation of tumor suppressor genes. Among the pivotal genetic alterations are Ki-RAS oncogene activation and p53 tumor suppressor gene inactivation. We explain that the combination of these genetic events facilitates pancreatic carcinogenesis as revealed in novel three-dimensional cell (spheroid cyst) culture and in vivo subcutaneous and orthotopic xenotransplantation models. N-cadherin, a member of the classic cadherins important in the regulation of cell-cell adhesion, is induced in the presence of Ki-RAS mutation but subsequently downregulated with the acquisition of p53 mutation as revealed by gene microarrays and corroborated by reverse transcription-PCR and Western blotting. N-cadherin modulates the capacity of pancreatic ductal cells to migrate and invade, in part via complex formation with keratinocyte growth factor receptor and neural cell adhesion molecule and in part via interaction with p120-catenin. However, modulation of these complexes by Ki-RAS and p53 leads to enhanced cell migration and invasion. This preferentially induces the downstream effector AKT over mitogen-activated protein kinase to execute changes in cellular behavior. Thus, we are able to define molecules that in part are directly affected by Ki-RAS and p53 during pancreatic ductal carcinogenesis, and this provides a platform for potential new molecularly based therapeutic interventions.


Figures

FIG. 1.
FIG. 1.
Ki-RASG12V/p53V143A-PDC display increased migration and invasion. (A) Pancreatic ductal cells representing the different genotypes were seeded on noncoated Boyden chamber membranes for migration assays. After 24 h, the cells that did not migrate were removed using cotton swabs. The migrating cells were stained and quantified by averaging 10 individual fields. (B) Pancreatic ductal cells representing the different genotypes were seeded on Matrigel-coated Boyden chamber membranes for invasion assays. After 24 h, the cells that did not invade were removed while the invading cells were stained and quantified by averaging 10 individual fields. Symbols: *, P < 0.02 (Ki-RASG12V/p53V143A-PDC versus Ki-RASG12V-PDC or p53V143A-PDC), #, P < 0.05 (Ki-RASG12V-PDC versus WT-PDC). The data were obtained from three independent experiments performed in duplicate.
FIG. 2.
FIG. 2.
Three-dimensional spheroid cysts derived from Ki-RASG12V/p53V143A-PDC reveal disrupted cellular architecture. (A and B) Typical spheroid cyst from WT-PDC grown in collagen type I gel for 7 days. (A) Phase-contrast photomicrograph taken at ×100 magnification. (B) Confocal imaging of immunofluorescence staining of a methanol-acetone-fixed cyst stained for E-cadherin (red), actin (green), and DAPI (blue). (C to E) Disrupted spheroid cyst from Ki-RASG12V/p53V143A-PDC grown in collagen type I matrix for 7 days. (C) Phase-contrast photomicrograph taken at ×100 magnification. (D to E) Confocal imaging of immunofluorescence staining of a methanol-acetone-fixed cyst of Ki-RASG12V/p53V143A-PDC stained for E-cadherin (red), actin (green), and DAPI (blue). (F and G) Serial confocal microscopic cross sections of spheroid cysts derived from the PDC. (F) WT-PDC were cultured on type I collagen matrix for 7 days, immunostained for E-cadherin (red) as a basolateral marker and actin (green) as an apical marker, and DAPI counterstained for nuclei (blue). (G) Disrupted cellular architecture and loss of polarity were uniquely evident from Ki-RASG12V/p53V143A-PDC derived spheroid cysts. Arrows indicate protruding cells. The top of the cyst appears as a sheet of cells. By contrast, the equatorial section appears as a ring due to the presence of a hollow lumen. Scale bars for all panels = 50 μm.
FIG. 3.
FIG. 3.
Ki-RASG12V/p53V143A-PDC grow in an anchorage-independent manner. In six-well culture plates, 2 × 10⁵ cells suspended in 0.5% agarose/DMEM/F12 full medium were overlaid onto a base layer of 1% agarose-DMEM-F12 full medium. The cells were incubated for 3 weeks, and colonies were visualized by phase-contrast microscopy and photodocumented. Panels: (A) WT-PDC (magnification, ×20); (B) p53V143A-PDC (magnification, ×20); (C) Ki-RASG12V-PDC (magnification, ×20); (D and E) Ki-RASG12V/p53V143A-PDC (magnification, ×20 and ×100, respectively).
FIG. 4.
FIG. 4.
In vivo bioluminescence imaging of WT-PDC, p53V143A-PDC, Ki-RASG12V-PDC, and Ki-RASG12V/p53V143A-PDC stably transduced with a pFB-neo/luc retroviral vector. Irradiated immunodeficient mice received subcutaneous injections of 1 × 10⁷ cells suspended in a 1:1 ratio of Matrigel/DMEM/F12 full medium. Animals were imaged weekly for 10 weeks to monitor tumor growth. (A) Correlation between tumor volume (mm3) and bioluminescence signal (photons per second [ph/s]) at various time points of tumor development in mice injected with WT-luc-PDC, p53V143A-luc-PDC, Ki-RASG12V-luc-PDC, and Ki-RASG12V/p53V143A-luc-PDC. Data are shown for individual mice at 1 to 8 weeks after subcutaneous injections (R2 = 0.72). (B) After 10 weeks, ex vivo imaging of excised tumor tissues confirmed the presence of luciferase activity arising only from the Ki-RASG12V/p53V143A-luc-PDC. Bioluminescence was measured 20 min after injection of the d-luciferin substrate. (C) Bioluminescence and growth of subcutaneous luc-PDC tumors are shown for week 5 and week 8 after subcutaneous injections of WT-luc-PDC (n = 6), p53V143A-luc-PDC (n = 6), Ki-RASG12V-luc-PDC (n = 7), and Ki-RASG12V/p53V143A-luc-PDC (n = 5), with a horizontal bar representing the mean value for each cell line. n, number of tumors considered for this experiment. *, P was <0.05 for Ki-RASG12V/p53V143A-PDC versus WT-luc-PDC, p53V143A-luc-PDC, or Ki-RASG12V-luc-PDC.
FIG. 5.
FIG. 5.
Representative tumors isolated from immunodeficient mice injected with Ki-RASG12V/p53V143A-PDC. (A) Hematoxylin and eosin (H&E) staining of two representative tumors (magnification, ×600). Positive staining in tumor cells of the mesenchymal markers, S-100 and vimentin, with reduced staining of the epithelial markers, pancytokeratin and E-cadherin. (B) Phase-contrast photomicrographs taken at ×40 magnification showing two types of colonies observed in cells isolated from Ki-RASG12V/p53V143A-PDC subcutaneous tumors and grown on collagen type I. (C) Bioluminescence signals of subcutaneous tumor growth at week 4 after mice were injected with Ki-RASG12V/p53V143A-luc-PDC (1) or tumor-derived cells (2). n, number of tumors studied for this experiment; ph/s, photons per second. *, P was <0.05 for bioluminescence activities in the subcutaneous tumors of tumor-derived cells versus Ki-RASG12V/p53V143A-PDC. (D). H&E staining of subcutaneous tumor from tumor-derived RASG12V/p53V143A-luc-PDC (magnification, ×600).
FIG. 6.
FIG. 6.
In vivo bioluminescence and MR imaging of immunodeficient mice injected orthotopically with Ki-RASG12V/p53V143A-luc-PDC. WT-luc-PDC, p53V143A-luc-PDC, Ki-RASG12V-luc-PDC, and Ki-RASG12V/p53V143A-luc-PDC were injected deep into the pancreatic tails of six mice for each cell line (n = 6). Five weeks after implantation, bioluminescence was measured and MR imaging was performed. The number of mice presenting pancreatic focal tumors detectable by bioluminescence imaging is indicated in the table for each cell line. K, kidney; S, spleen.
FIG. 7.
FIG. 7.
Differential expression of N-cadherin in WT-PDC, p53V143A-PDC, Ki-RASG12V-PDC, and Ki-RASG12V/p53V143A-PDC. (A) Gene microarray results showing cadherin expression levels in Ki-RASG12V-PDC versus WT-PDC. Quantitative analysis of N-cadherin and β-actin transcript levels by RT-PCR and protein levels by Western blotting were assessed in WT-PDC, p53V143A-PDC, Ki-RASG12V-PDC, and Ki-RASG12V/p53V143A-PDC. These analyses are representative of several experiments. Densitometry of N-cadherin mRNA and protein levels was performed using Scion Image Beta 4.02 software (Frederick, MD) and calibrated with the β-actin signal. The N-cadherin protein level of WT-PDC was set at 1.0. (B) Indirect immunofluorescence of N-cadherin (red), E-cadherin (red), and β-catenin (red) in PDC grown in a monolayer. Nuclei were counterstained with DAPI (blue). Magnification, ×400. (C) Indirect immunofluorescence of N-cadherin (red) and nuclei (blue) in PDC cysts grown in type I collagen. Arrows indicate partial loss of N-cadherin in Ki-RASG12V/p53V143A-PDC. Scale bar = 20 μm. Magnification, ×250.
FIG. 8.
FIG. 8.
KGFR is the FGFR-specific isoform that associates with N-cadherin and N-CAM. (A) Gene microarray results showing N-CAM and FGFR-2 transcript levels in WT-PDC, p53V143A-PDC, Ki-RASG12V-PDC, and Ki-RASG12V/p53V143A-PDC, with transcript levels in WT-PDC set at 1.0. (B) Western blots show N-cadherin, N-CAM, and FGFR-2 protein expression in the PDC and confirm the microarray results. (C) Immunoprecipitation (IP) of N-cadherin followed by immunoblotting for N-CAM and FGFR-2. (D) Alternative splicing of FGFR-2. Amplification of the FGFR-2-specific PCR product followed by digestion with restriction enzymes determined which FGFR-2 isoform is expressed in the PDC. FGFR-2 PCR products amplified from WT-PDC and Ki-RASG12V-PDC are digested with AvaI only, suggesting that FGFR-2(IIIb) or KGFR is the only isoform expressed in the PDC. U, undigested PCR products; A and H, PCR products digested with restriction enconucleases AvaI and HincII, respectively. (E) Gene microarray results of p120-catenin transcript levels in WT-PDC, p53V143A-PDC, Ki-RASG12V-PDC, and Ki-RASG12V/p53V143A-PDC, with expression of WT-PDC set at 1.0. (F) Western blotting (IB) for p120-catenin in the PDC confirms the microarray results.
FIG. 9.
FIG. 9.
Disruption of the N-cadherin/KGFR/N-CAM complex in Ki-RASG12V-PDC leads to an increase in cell migration. (A) Ki-RASG12V-PDC were preincubated with the N-cadherin-neutralizing antibody GC-4 or control IgG for 20 min prior to migration assays. Ki-RASG12V/NcadΔECD-PDC and Ki-RASG12V/dnKGFR-PDC demonstrated an increase in migration compared to Ki-RASG12V-PDC. A synergistic increase in cell migration was observed in Ki-RASG12V/dnKGFR-PDC pretreated with GC-4. *, P was <0.02 for Ki-RASG12V-PDC treated with GC-4, Ki-RASG12V/NcadΔECD-PDC, and Ki-RASG12V/dnKGFR-PDC versus the Ki-RASG12V-PDC control. #, P was <0.0001 for GC-4-treated versus untreated Ki-RASG12V/dnKGFR-PDC. (B) Western blotting demonstrates the effects of specific inhibitors on AKT phosphorylation (P-AKT) and extracellular signal-regulated kinase 1/2 phosphorylation (P-MAPK). Ki-RASG12V-PDC were incubated in the presence of 10 μM AKT specific inhibitor (AKTi1/2), 50 μM PI3K inhibitor (LY294002), or 10 μM MEK1/2 inhibitor (U0126) for 24 h. DMSO, dimethyl sulfoxide. (C and D) Migrating or invading cells were stained and quantified after 24 h. The data shown are expressed as means ± standard deviations of 10 individual fields from at least two independent experiments performed in duplicate. (C) Ki-RASG12V-PDC were incubated in the presence or absence of 10 μM U0126, 50 μM LY294002, or 10 μM AKTi1/2 for the duration of the migration assay. N-cadherin-neutralizing antibody GC-4-dependent migration was decreased partially by U0126 and robustly by LY294002. ANOVA was used to compare AKTi1/2-treated to untreated Ki-RASG12V-PDC (*, P < 0.002). (D) Ectopic expression of full-length N-cadherin in Ki-RASG12V/p53V143A-PDC (hygro-Ncad) decreased cell migration and invasion compared to control Ki-RASG12V/p53V143A-PDC (hygro). ANOVA was used to compare Ki-RASG12V/p53V143A-PDC expressing full-length N-cadherin or control hygro (*, P < 0.04). (E) N-cadherin-expressing Ki-RASG12V/p53V143A-PDC (hygro-Ncad) demonstrate an increase in p120-catenin expression compared to control hygro. Immunoprecipitation (IP) for p120-catenin was followed by immunoblotting (IB) for N-cadherin. (F) Western blot shows that increased N-cadherin expression is accompanied by a decrease in activated or phosphorylated AKT, consistent with the inhibition of AKT shown in panel C.

Similar articles

Cited by

References

    1. Agbunag, C., and D. Bar-Sagi. 2004. Oncogenic K-ras drives cell cycle progression and phenotypic conversion of primary pancreatic duct epithelial cells. Cancer Res. 64:5659-5663. - PubMed
    1. Aguirre, A. J., N. Bardeesy, M. Sinha, L. Lopez, D. A. Tuveson, J. Horner, M. S. Redston, and R. A. DePinho. 2003. Activated Kras and Ink4a/Arf deficiency cooperate to produce metastatic pancreatic ductal adenocarcinoma. Genes Dev. 17:3112-3126. - PMC - PubMed
    1. Aguirre, A. J., C. Brennan, G. Bailey, R. Sinha, B. Feng, C. Leo, Y. Zhang, J. Zhang, J. D. Gans, N. Bardeesy, C. Cauwels, C. Cordon-Cardo, M. S. Redston, R. A. DePinho, and L. Chin. 2004. High-resolution characterization of the pancreatic adenocarcinoma genome. Proc. Natl. Acad. Sci. USA 101:9067-9072. - PMC - PubMed
    1. Alencar, H., R. King, M. Funovics, C. Stout, R. Weissleder, and U. Mahmood. 2005. A novel mouse model for segmental orthotopic colon cancer. Int. J. Cancer 117:335-339. - PubMed
    1. Almoguera, C., D. Shibata, K. Forrester, J. Martin, N. Arnheim, and M. Perucho. 1988. Most human carcinomas of the exocrine pancreas contain mutant c-K-ras genes. Cell 53:549-554. - PubMed

Publication types

MeSH terms

Substances