

Photometric recording of transmembrane potential in outer hair cells
- PMID: 16705263
- PMCID: PMC2716392
- DOI: 10.1088/1741-2560/3/2/001
Photometric recording of transmembrane potential in outer hair cells
Abstract
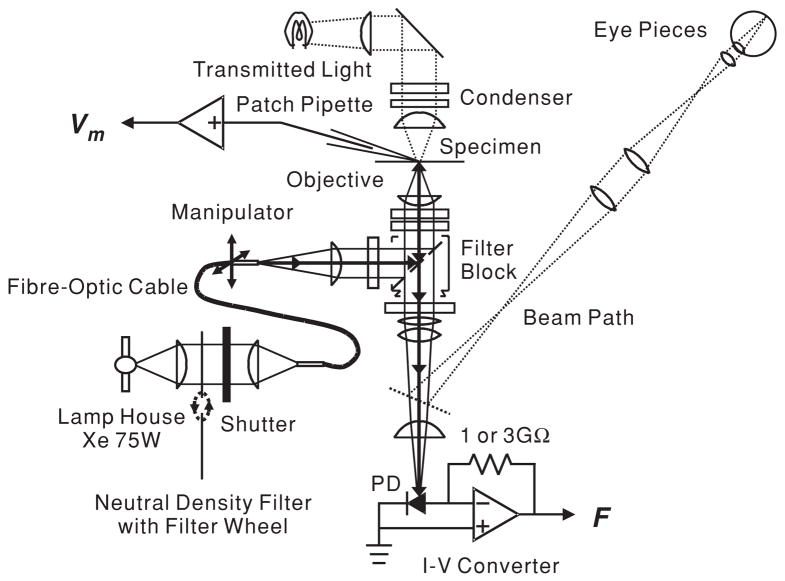
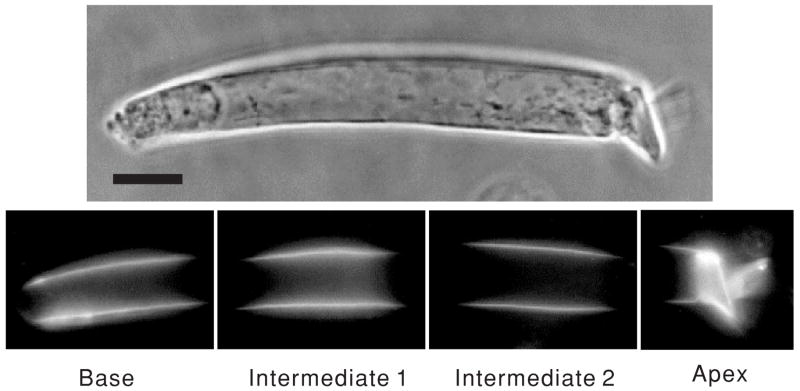
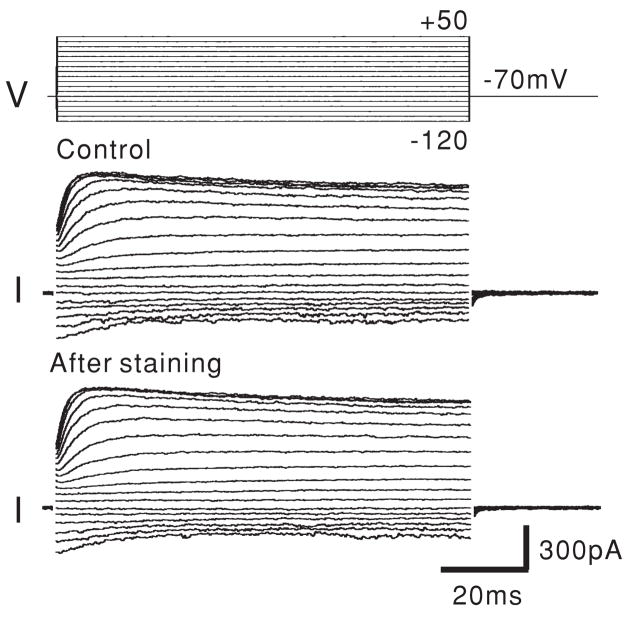
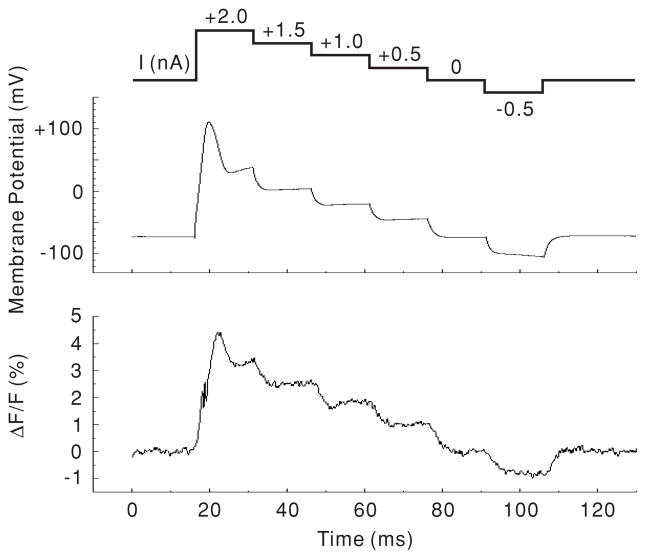
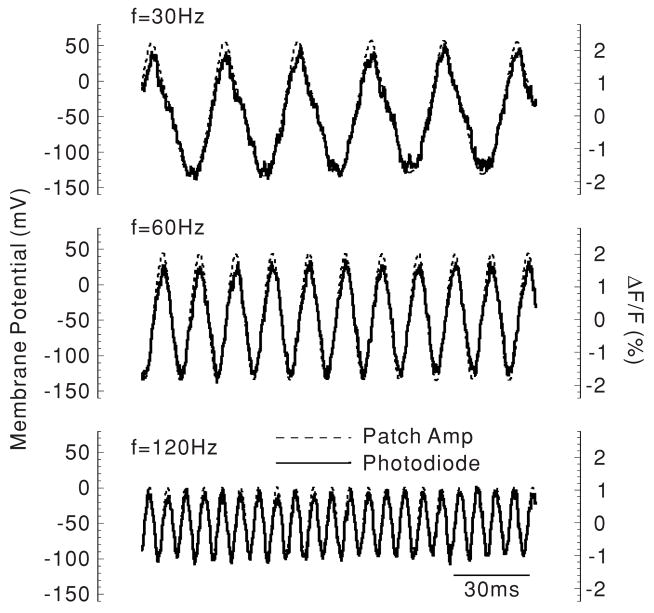
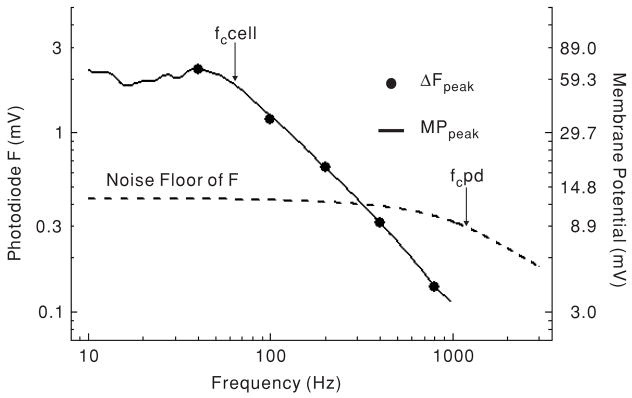
Cochlear outer hair cells (OHCs) are polarized epithelial cells that have mechanoelectrical transduction channels within their apical stereocilia and produce electromotile force along their lateral wall. Phase shifts, or time delays, in the transmembrane voltage occurring at different axial locations along the cell may contribute to our understanding of how these cells operate at auditory frequencies. We developed a method to optically measure the phase of the OHC transmembrane potential using the voltage-sensitive dye (VSD) di-8-ANEPPS. The exit aperture of a fibre-optic light source was driven in two dimensions so that a 24 microm spot of excitation light could be positioned along the length of the OHC. We used the whole-cell patch-clamp technique in the current-clamp mode to stimulate the OHC at the base. The photometric response and the voltage response were monitored with a photodetector and patch-clamp amplifier, respectively. The photometric response was used to measure the regional changes in the membrane potential in response to maintained (dc) and sinusoidal (ac) current stimuli applied at the base of the cell. We used a neutral density filter to lower the excitation light intensity and reduce phototoxicity. A sensitive detector and lock-in amplifier were used to measure the small ac VSD signal. This permitted measurements of the ac photometric response below the noise floor of the static fluorescence. The amplitude and phase components of the photometric response were recorded for stimuli up to 800 Hz. VSD data at 400-800 Hz show the presence of a small phase delay between the stimulus voltage at the base of the cell and the local membrane potential measured along the lateral wall. Results are consistent with the hypothesis that OHCs exhibit inhomogeneous membrane potentials that vary with position in analogy with the voltage in nerve axons.
Figures
References
-
- Bedlack RSJ, Wei M, Fox SH, Gross E, Loew LM. Distinct electric potentials in soma and neurite membranes. Neuron. 1994;13:1187–93. - PubMed
-
- Brownell WE. The piezoelectric outer hair cell. In: Eatock RA, editor. Vertebrate Hair Cells. New York: Springer; 2006. pp. 313–47.
-
- Brownell WE, Bader CR, Bertrand D, de Ribaupierre Y. Evoked mechanical responses of isolated cochlear hair cells. Science. 1985;227:194–6. - PubMed
-
- Brownell WE, Spector AA, Raphael RM, Popel AS. Micro- and nanomechanics of the cochlear outer hair cell. Annu Rev Biomed Eng. 2001;3:169–94. - PubMed
Publication types
MeSH terms
Substances
Grants and funding
LinkOut - more resources
Full Text Sources