Comparative Study
. 2006 May;23(9):2351-61.
doi: 10.1111/j.1460-9568.2006.04768.x.

Rapid phosphorylation of histone H2A.X following ionotropic glutamate receptor activation

Affiliations
Comparative Study

Rapid phosphorylation of histone H2A.X following ionotropic glutamate receptor activation

Samantha L Crowe et al. Eur J Neurosci. 2006 May.

Abstract

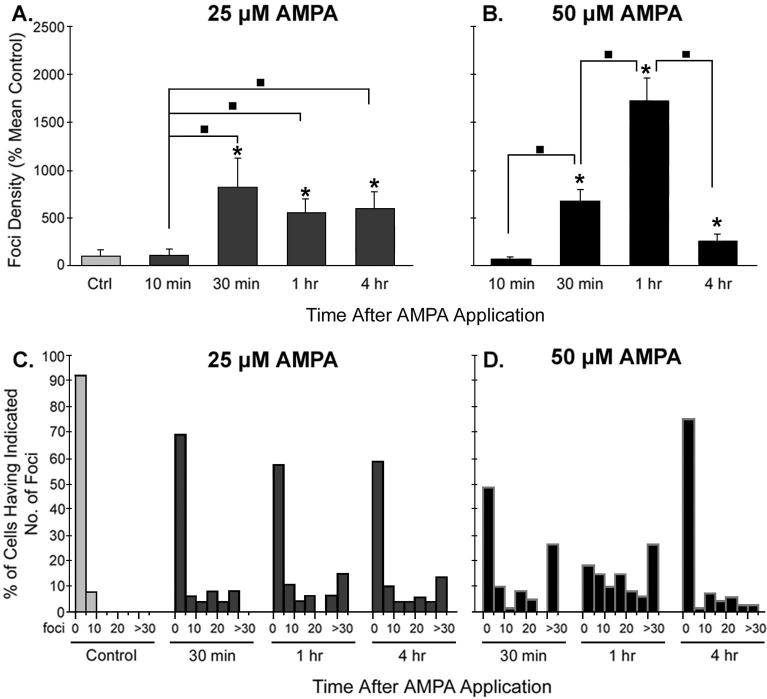
Excessive activation of ionotropic glutamate receptors increases oxidative stress, contributing to the neuronal death observed following neurological insults such as ischemia and seizures. Post-translational histone modifications may be key mediators in the detection and repair of damage resulting from oxidative stress, including DNA damage, and may thus affect neuronal survival in the aftermath of insults characterized by excessive glutamate release. In non-neuronal cells, phosphorylation of histone variant H2A.X (termed gamma-H2AX) occurs rapidly following DNA double-strand breaks. We investigated gamma-H2AX formation in rat cortical neurons (days in vitro 14) following activation of N-methyl-D-aspartate (NMDA) or alpha-amino-3-hydroxyl-5-methyl-4-isoxazolepropionic acid (AMPA)/kainate glutamate receptors using fluorescent immunohistochemical techniques. Moreover, we evaluated the co-localization of gamma-H2AX 'foci' with Mre11, a double-strand break repair protein, to provide further evidence for the activation of this DNA damage response pathway. Here we show that minimally cytotoxic stimulation of ionotropic glutamate receptors was sufficient to evoke gamma-H2AX in neurons, and that NMDA-induced gamma-H2AX foci formation was attenuated by pretreatment with the antioxidant, Vitamin E, and the intracellular calcium chelator, BAPTA-AM. Moreover, a subset of gamma-H2AX foci co-localized with Mre11, indicating that at least a portion of gamma-H2AX foci is damage dependent. The extent of gamma-H2AX induction following glutamate receptor activation corresponded to the increases we observed following conventional DNA damaging agents [i.e. non-lethal doses of gamma-radiation (1 Gy) and hydrogen peroxide (10 microm)]. These data suggest that insults not necessarily resulting in neuronal death induce the DNA damage-evoked chromatin modification, gamma-H2AX, and implicate a role for histone alterations in determining neuronal vulnerability following neurological insults.


Figures

Figure 1
Figure 1
Increased γ-H2AX formation in cortical neurons following ionizing radiation. A-C, Time course for γ-H2AX formation following 1 Gy of radiation. A, Representative confocal images of γ-H2AX immunostaining in untreated-control neurons (left panel) and 10 min (middle) and 4 hr (right) after 1 Gy of radiation. White dots of varying sizes are γ-H2AX “foci”. Cells were identified with neuronal nuclear antigen staining (not shown) and nuclei were visualized with DAPI and outlined with dashed lines on γ-H2AX images. Nuclei having an apoptotic morphology were excluded from analysis. Scale bar, 10 μm. B, Distributions of the percent of neurons having 0-5, 6-10, 11-15, 16-20, 21-25, 26-30, and > 30 foci (expressed as a percentage of the total number of DAPI stained cells counted for each group). C, γ-H2AX increased transiently following 1 Gy of radiation. Average foci density was calculated as a percent of the mean value for untreated-control neurons (N = 100-110 neurons per group). D, Increases in γ-H2AX foci density following irradiation were dosedependent (% mean untreated controls ± SEM; N = 80, 60, and 55 for 0, 1, and 5 Gy, respectively). Neurons were irradiated and incubated for 30 min before measuring γ-H2AX foci density. * p < 0.05 as compared to untreated controls; ■ p < 0.05 as compared among time points or treatments; Kruskal-Wallis followed by post hoc LSD rank
Figure 2
Figure 2
γ-H2AX and Mre11 co-localization 1 hr following 1 Gy of ionizing radiation. Confocal images of the representative co-localization of γ-H2AX foci (red; left panel) and Mre11 foci (green; middle panel) following irradiation. Merging the images revealed that the majority of discrete, radiation-induced γ-H2AX foci co-localized with Mre11 foci (white arrows; yellow foci; right panel). Scale bar, 10 μm
Figure 3
Figure 3
LDH release measurements of neuronal death following ionotropic glutamate receptor activation. NMDA (A) and AMPA (B) caused a dose-dependent increase in LDH release 24 hr after treatment. LDH results are expressed as % cytotoxicity (AMPA- or NMDA-evoked LDH release divided by LDH release following total cell lysis with 0.1% Triton-X). A’, Pretreatment with 20 μM MK801 blocked the NMDA-induced LDH release following treatment with 50 μM NMDA. B’, Pretreatment with 20 μM NBQX attenuated the AMPA-induced LDH release following treatment with 250 μM of AMPA, yet it did not completely block the AMPA-induced injury. Co-application of NBQX (20 μM) and MK801 (20 μM) prior to AMPA exposure completely blocked AMPA-induced injury. (N = 6 for all groups, *p < 0.05 and p**< 0.01 as compared to controls; ■ p < 0.05 and ■ ■ p < 0.01 as compared among treatments; ANOVA followed by post hoc Tukey).
Figure 4
Figure 4
γ-H2AX foci patterns following NMDA receptor activation. A, Representative patterns shown are of neurons treated with 50 μM NMDA. Right-most picture showing bright γ-H2AX immunostaining covering the entire nuclear region represents neurons that were excluded from the analyses (see Methods). 25 μM and 50 μM AMPA and 15 μM NMDA treatment produced similar foci patterns. B and C, DAPI (left column) and γ-H2AX (right column) staining revealed that foci-positive cells had normal nuclear morphology. B, Foci-positive cells did not have apoptotic nuclear morphology (top) with the exception of a population of nuclei that were completely filled with bright γ-H2AX foci (bottom, white arrow). Although not all bright nuclei appeared apoptotic, all cells with this staining pattern were excluded from the analysis. C, By 4 hr following 15 μM NMDA treatment, the number of γ-H2AX foci returned to that of untreated control neurons in a majority of neurons. Both foci-positive cells (white arrow) and those neurons having control foci levels (< 5 foci) had normal nuclei free of apoptotic features. Scale bar, 10 μm
Figure 5
Figure 5
Effects of NMDA on γ-H2AX formation in cortical neurons. A and B, Average density of γ-H2AX foci following treatment with 15 μM (A) or 50 μM (B) NMDA (% mean untreated controls ± SEM; N = 51-68 for 15 μM; N = 50-58 for 50 μM). A’ and B’, the average foci density per nucleus following a pulse application of 15 μM (A’) or 50 μM (B’) of NMDA (N = 50 for all groups). MK801 (20 μM) was added 10 min after NMDA application. C and D, Distributions of the percent of neurons having 0-5, 6-10, 11-15, 16-20, 21-25, 26-30, and > 30 foci following application of 15 μM (C) or 50 μM (D) NMDA (expressed as a percentage of the total number of DAPI stained cells counted for each group). * p < 0.05 as compared to untreated controls; ■ p < 0.05 as compared among treatments; Kruskal-Wallis followed by post hoc LSD rank
Figure 6
Figure 6
LDH release measurements of neuronal death following continuous or a pulse exposure to NMDA. LDH release was measured 24 hr after applying NMDA and is expressed as % cytotoxicity (NMDA-evoked LDH release divided by total LDH release following cell lysis with 0.1% Triton-X). For the pulse exposure to NMDA (patterned bars), MK801 (20 μM) was added to the bathing media 10 min after NMDA application. (N = 6 for all groups, * p < 0.05 and ** p < 0.01 as compared to controls; ■ p < 0.05 and ■ ■ p < 0.01 as compared among treatments; ANOVA followed by post hoc Tukey)
Figure 7
Figure 7
AMPA-induced γ-H2AX formation in cortical neurons. A and B, Average density of γ-H2AX following treatment with 25 μM (A) or 50 μM (B) AMPA (% mean untreated controls ± SEM; N = 50-52 for 25 μM; N = 59-67 for 50 μM). C and D, Distributions of the percent of neurons having 0-5, 6-10, 11-15, 16-20, 21-25, 26-30, and > 30 foci following application of 25 μM (C) or 50 μM (D) AMPA (expressed as a percentage of the total number of DAPI stained cells counted for each group). Cultures were pretreated with MK801 (20 μM)30 min prior to AMPA exposureto block the effects of secondary glutamate release on NMDA receptors. * p < 0.05 as compared to untreated controls;■ p < 0.05 as compared among treatments; Kruskal-Wallis followed by post hoc LSD rank
Figure 8
Figure 8
Pretreatment with BAPTA-AM or vitamin E attenuates NMDA-evoked γ-H2AX foci. Average γ-H2AX foci density per nucleus following NMDA (A) or AMPA (B) treatment (% mean vehicle (DMSO)-treated controls ± SEM; N = 71 for controls; N = 60-72 for AMPA-treated groups; N = 85-105 for NMDA-treated groups). DMSO, Vit E (vitamin E), or BAPTA-AM were added prior to adding glutamate receptor agonists (see Methods), and γ-H2AX was measured at 10 min or 1 hr after NMDA or AMPA treatment, respectively. For all AMPA experiments, cultures were pretreated with MK801 (20 μM) to block the effects of secondary glutamate release on NMDA receptors.* p < 0.05 as compared to untreated controls; ■ p < 0.05 as compared among treatments; Kruskal-Wallis followed by post hoc LSD rank
Figure 9
Figure 9
Co-localization of γ-H2AX and Mre11 foci following ionotropic glutamate receptor activation. A and B, Immunoreactivity for γ-H2AX (red, left panels) and Mre11 (green, middle panels) 10 min following 15 μM NMDA treatment (A) or 1hr post 25 μM AMPA application (B). Merged images (right panels) show colocalization of γ-H2AX and Mre11 foci (yellow foci). Mre11 staining could be observed throughout the nucleoplasm with the exception of the nucleolus and, to a lesser extent, was observed in the cytoplasm of some cells. The majority of large, discrete γ-H2AX foci co-localized with Mre11. There was a population of smaller, less intense γ-H2AX foci that did not co-localize with Mre11 at the time points investigated. There was a population of nuclear Mre11 foci that did not co-localize with γ-H2AX. Scale bar, 10 μm.

References

    1. Balajee AS, Geard CR. Replication protein A and gamma-H2AX foci assembly is triggered by cellular response to DNA double-strand breaks. Exp. Cell Res. 2004;300:320–334. - PubMed
    1. Barnham KJ, Masters CL, Bush AI. Neurodegenerative diseases and oxidative stress. Nat. Rev. Drug Discov. 2004;3:205–214. - PubMed
    1. Bassing CH, Alt FW. H2AX may function as an anchor to hold broken chromosomal DNA ends in close proximity. Cell Cycle. 2004;3:149–153. - PubMed
    1. Blaisdell JO, Harrison L, Wallace SS. Base excision repair processing of radiation-induced clustered DNA lesions. Radiat. Prot. Dosimetry. 2001;97:25–31. - PubMed
    1. Brooks PJ. DNA repair in neural cells: basic science and clinical implications. Mutat. Res. 2002;509:93–108. - PubMed

Publication types

MeSH terms

LinkOut - more resources